Cisco 2013 Annual Report Download - page 59
Download and view the complete annual report
Please find page 59 of the 2013 Cisco annual report below. You can navigate through the pages in the report by either clicking on the pages listed below, or by using the keyword search tool below to find specific information within the annual report.-
 1
1 -
2
-
3
-
4
-
5
-
6
-
7
-
8
-
9
-
10
-
11
-
12
-
13
-
14
-
15
-
16
-
17
-
18
-
19
-
20
-
21
-
22
-
23
-
24
-
25
-
26
-
27
-
28
-
29
-
30
-
31
-
32
-
33
-
34
-
35
-
36
-
37
-
38
-
39
-
40
-
41
-
42
-
43
-
44
-
45
-
46
-
47
-
48
-
 49
49 -
 50
50 -
 51
51 -
 52
52 -
 53
53 -
 54
54 -
 55
55 -
 56
56 -
 57
57 -
 58
58 -
 59
59 -
 60
60 -
 61
61 -
 62
62 -
 63
63 -
 64
64 -
 65
65 -
 66
66 -
 67
67 -
 68
68 -
 69
69 -
70
-
71
-
72
-
73
-
74
-
75
-
76
-
77
-
78
-
79
-
80
-
81
-
82
-
83
-
84
-
85
-
86
-
87
-
88
-
89
-
90
-
91
-
92
-
93
-
94
-
95
-
96
-
97
-
98
-
99
-
100
-
101
-
102
-
103
-
104
-
105
-
106
-
107
-
108
-
109
-
110
-
111
-
112
-
113
-
114
-
115
-
116
-
117
-
118
-
119
-
120
-
121
-
122
-
123
-
124
-
125
-
126
-
127
-
128
-
129
-
130
-
131
-
132
-
133
-
134
-
135
-
136
-
137
-
138
-
139
-
140
 |
 |

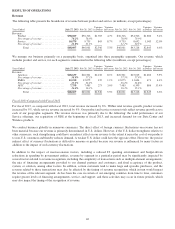
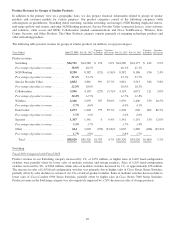
Communications infrastructure products as a result of our sales emphasis on shifting towards products with recurring revenue
streams.
Fiscal 2012 Compared with Fiscal 2011
For fiscal 2012, as compared with fiscal 2011, sales of Collaboration products increased by 3%, or $121 million. The increase
was due to a 5% increase in sales of unified communications products, primarily IP phones and collaborative web-based
offerings, partially offset by a 1% decrease in sales of Cisco TelePresence systems. Challenges in both the public sector and
demand weakness in Europe, along with our execution challenges related to our sales coverage model, contributed to the
decrease in sales of Cisco TelePresence systems in fiscal 2012.
Wireless
Fiscal 2013 Compared with Fiscal 2012
Sales of Wireless products increased by 31%, or $507 million. This increase reflects the continued customer adoption of and
migration to the unified access architecture of the Cisco Unified Wireless Network, and also reflects increased sales of new
products in this category as well as sales of products related to our acquisition of Meraki.
Fiscal 2012 Compared with Fiscal 2011
For fiscal 2012, as compared with fiscal 2011, sales of Wireless products increased by 19%, or $259 million. These increases
reflect the continued customer adoption of our wireless architecture and new product performance.
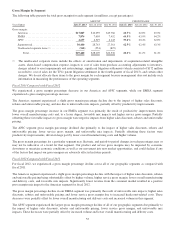
Data Center
Fiscal 2013 Compared with Fiscal 2012
We experienced strong growth in our Data Center product category, which grew by 60%, or $775 million, with strong sales
growth of our Cisco Unified Computing System products across all geographic segments and customer markets. The increase
was due in large part to the continued momentum we are experiencing with our products for both data center and cloud
environments, as current customers increase their data center build-outs and as new customers deploy these offerings.
To the extent our data center business grows and further penetrates the market, we expect that, in comparison to what we
experienced during the initial rapid growth of this business, the growth rates for our data center product sales will experience
more normal seasonality consistent with the overall server market.
Fiscal 2012 Compared with Fiscal 2011
For fiscal 2012, as compared with fiscal 2011, sales of Data Center products increased by 86%, or $602 million, due to
increased sales of Cisco Unified Computing System products. The increase was due to the momentum we are experiencing
with our products for the enterprise and service provider data center and cloud environments, as current customers increase
their data center build out, and new customer product purchases.
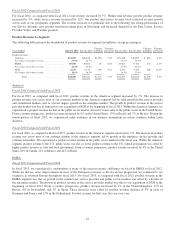
Security
Fiscal 2013 Compared with Fiscal 2012
Sales of Security products were flat as higher sales in high-end firewall products within our network security product portfolio
were offset by lower sales of our content security products.
Fiscal 2012 Compared with Fiscal 2011
For fiscal 2012, as compared with fiscal 2011, sales of Security products increased by 13%, or $150 million. These increases
were primarily due to growth in our network security products driven by the recent update of our firewall security product
portfolio.
Other Products
Fiscal 2013 Compared with Fiscal 2012
We experienced a 34%, or $339 million, decrease in sales of Other Products due in large part to lower sales of our Linksys
products, which product line we sold during the third quarter of fiscal 2013.
Fiscal 2012 Compared with Fiscal 2011
The decrease in sales of Other Products for fiscal 2012 was primarily due to lower sales of Flip Video camera products in
connection with our decision in fiscal 2011 to exit this consumer product line.
51