Cisco 2013 Annual Report Download - page 47
Download and view the complete annual report
Please find page 47 of the 2013 Cisco annual report below. You can navigate through the pages in the report by either clicking on the pages listed below, or by using the keyword search tool below to find specific information within the annual report.-
 1
1 -
2
-
3
-
4
-
5
-
6
-
7
-
8
-
9
-
10
-
11
-
12
-
13
-
14
-
15
-
16
-
17
-
18
-
19
-
20
-
21
-
22
-
23
-
24
-
25
-
26
-
27
-
28
-
29
-
30
-
31
-
32
-
33
-
34
-
35
-
36
-
 37
37 -
 38
38 -
 39
39 -
 40
40 -
 41
41 -
 42
42 -
 43
43 -
 44
44 -
 45
45 -
 46
46 -
 47
47 -
 48
48 -
 49
49 -
 50
50 -
 51
51 -
 52
52 -
 53
53 -
 54
54 -
 55
55 -
 56
56 -
 57
57 -
58
-
59
-
60
-
61
-
62
-
63
-
64
-
65
-
66
-
67
-
68
-
69
-
70
-
71
-
72
-
73
-
74
-
75
-
76
-
77
-
78
-
79
-
80
-
81
-
82
-
83
-
84
-
85
-
86
-
87
-
88
-
89
-
90
-
91
-
92
-
93
-
94
-
95
-
96
-
97
-
98
-
99
-
100
-
101
-
102
-
103
-
104
-
105
-
106
-
107
-
108
-
109
-
110
-
111
-
112
-
113
-
114
-
115
-
116
-
117
-
118
-
119
-
120
-
121
-
122
-
123
-
124
-
125
-
126
-
127
-
128
-
129
-
130
-
131
-
132
-
133
-
134
-
135
-
136
-
137
-
138
-
139
-
140
 |
 |

Fourth Quarter Snapshot
For the fourth quarter of fiscal 2013, as compared with the corresponding period in fiscal 2012, revenue increased by 6%, with
both product and service revenue increasing by 6%. With regard to our geographic segment performance, on a year-over-year
basis, revenue increased by 7% in the Americas, increased by 12% in EMEA, and decreased by 3% in APJC. Total gross
margin decreased by 1.4 percentage points, primarily as a result of the TiVo patent litigation settlement. As a percentage of
revenue, research and development, sales and marketing, and general and administrative expenses collectively declined by
2.9 percentage points, primarily due to lower general and administrative expenses. For the fourth quarter of fiscal 2012,
general and administrative expenses included $202 million of real estate charges, primarily related to impairment charges on
real estate held for sale. Operating income as a percentage of revenue increased by 2.4 percentage points, primarily as a result
of lower general and administrative expenses, lower restructuring and other charges, and also the impact of our revenue
increase. Diluted earnings per share increased by 17% from the prior year period, primarily as a result of an 18% increase in
net income.
Strategy and Focus Areas
Our focus continues to be on our five foundational priorities:
• Leadership in our core business (routing, switching, and associated services) which includes comprehensive security
and mobility solutions
• Collaboration
• Data center virtualization and cloud
• Video
• Architectures for business transformation
We believe that focusing on these priorities best positions us to continue to expand our share of our customers’ information
technology spending. For a full discussion of our strategy and focus areas, see Item 1. Business.
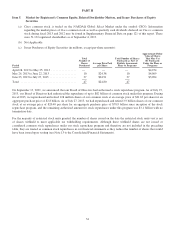
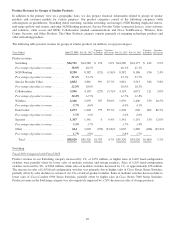
Other Key Financial Measures
The following is a summary of our other key financial measures for fiscal 2013 compared with fiscal 2012 (in millions, except
days sales outstanding in accounts receivable (DSO) and annualized inventory turns):
Fiscal 2013 Fiscal 2012
Cash and cash equivalents and investments ................................................ $50,610 $48,716
Cash provided by operating activities ..................................................... $12,894 $11,491
Deferred revenue ..................................................................... $13,423 $12,880
Repurchases of common stock—stock repurchase program ................................... $ 2,773 $ 4,360
Dividends .......................................................................... $ 3,310 $ 1,501
DSO............................................................................... 40 days 34 days
Inventories ......................................................................... $ 1,476 $ 1,663
Annualized inventory turns ............................................................. 13.8 11.7
Our product backlog at the end of fiscal 2013 was $4.9 billion, or 10% of fiscal 2013 total revenue, compared with $5.0 billion
at the end of fiscal 2012, or 11% of fiscal 2012 total revenue.
39