Cisco 2013 Annual Report Download - page 55
Download and view the complete annual report
Please find page 55 of the 2013 Cisco annual report below. You can navigate through the pages in the report by either clicking on the pages listed below, or by using the keyword search tool below to find specific information within the annual report.-
 1
1 -
2
-
3
-
4
-
5
-
6
-
7
-
8
-
9
-
10
-
11
-
12
-
13
-
14
-
15
-
16
-
17
-
18
-
19
-
20
-
21
-
22
-
23
-
24
-
25
-
26
-
27
-
28
-
29
-
30
-
31
-
32
-
33
-
34
-
35
-
36
-
37
-
38
-
39
-
40
-
41
-
42
-
43
-
44
-
 45
45 -
 46
46 -
 47
47 -
 48
48 -
 49
49 -
 50
50 -
 51
51 -
 52
52 -
 53
53 -
 54
54 -
 55
55 -
 56
56 -
 57
57 -
 58
58 -
 59
59 -
 60
60 -
 61
61 -
 62
62 -
 63
63 -
 64
64 -
 65
65 -
66
-
67
-
68
-
69
-
70
-
71
-
72
-
73
-
74
-
75
-
76
-
77
-
78
-
79
-
80
-
81
-
82
-
83
-
84
-
85
-
86
-
87
-
88
-
89
-
90
-
91
-
92
-
93
-
94
-
95
-
96
-
97
-
98
-
99
-
100
-
101
-
102
-
103
-
104
-
105
-
106
-
107
-
108
-
109
-
110
-
111
-
112
-
113
-
114
-
115
-
116
-
117
-
118
-
119
-
120
-
121
-
122
-
123
-
124
-
125
-
126
-
127
-
128
-
129
-
130
-
131
-
132
-
133
-
134
-
135
-
136
-
137
-
138
-
139
-
140
 |
 |

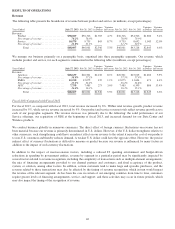
Fiscal 2012 Compared with Fiscal 2011
For fiscal 2012, as compared with fiscal 2011, total revenue increased by 7%. Within total revenue growth, product revenue
increased by 5%, while service revenue increased by 12%. Our product and service revenue totals reflected revenue growth
across each of our geographic segments. The revenue increase was primarily due to the following: the strong performance of
our Service offerings; new product transitions taking place in Switching; and increased demand for our Data Center, Service
Provider Video, and Wireless products.
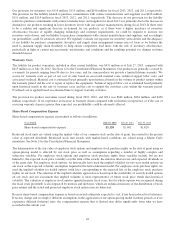
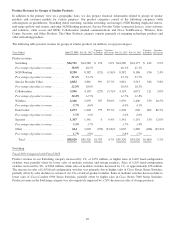
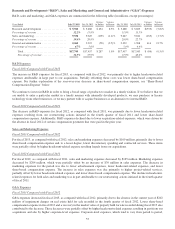
Product Revenue by Segment
The following table presents the breakdown of product revenue by segment (in millions, except percentages):
Years Ended July 27, 2013 July 28, 2012
Variance
in Dollars
Variance
in Percent July 28, 2012 July 30, 2011
Variance
in Dollars
Variance
in Percent
Product revenue:
Americas .................................. $21,653 $20,168 $1,485 7.4% $20,168 $19,292 $ 876 4.5%
Percentage of product revenue ................. 57.0% 55.5% 55.5% 55.9%
EMEA .................................... 10,049 10,024 25 0.2% 10,024 9,788 236 2.4%
Percentage of product revenue ................. 26.4% 27.6% 27.6% 28.3%
APJC ..................................... 6,327 6,134 193 3.1% 6,134 5,446 688 12.6%
Percentage of product revenue ................. 16.6% 16.9% 16.9% 15.8%
Total ............................... $38,029 $36,326 $1,703 4.7% $36,326 $34,526 $1,800 5.2%
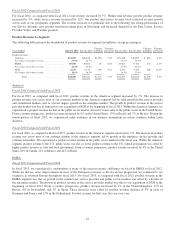
Americas
Fiscal 2013 Compared with Fiscal 2012
For fiscal 2013, as compared with fiscal 2012, product revenue in the Americas segment increased by 7%. The increase in
product revenue was across most of our customer markets in the Americas segment, led by solid growth in the service provider
and commercial markets and, to a lesser degree, growth in the enterprise market. The growth in product revenue in the service
provider market was due in large part to our acquisition of NDS at the beginning of fiscal 2013. Within the Americas segment, we
experienced a product revenue decline in the public sector market, driven by lower sales to the public sector in the United States.
From a country perspective, product revenue increased by 9% in the United States, 13% in Brazil, and 7% in Mexico. During the
fourth quarter of fiscal 2013, we experienced some weakness in our business momentum in certain countries within Latin
America.
Fiscal 2012 Compared with Fiscal 2011
For fiscal 2012, as compared with fiscal 2011, product revenue in the Americas segment increased by 5%. The increase in product
revenue was across most of our customer markets in the Americas segment, led by growth in the enterprise, service provider and
commercial markets. We experienced a product revenue decline in the public sector market for the fiscal year. Within the Americas
segment, product revenue to the U.S. public sector was flat, as lower product revenue to the U.S. federal government was offset by
higher product revenue to state and local government. From a country perspective, product revenue increased by 4% in the United
States, 10% in Canada, 21% in Mexico, and 14% in Brazil.
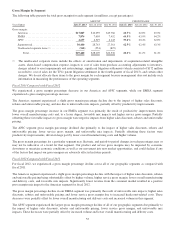
EMEA
Fiscal 2013 Compared with Fiscal 2012
In fiscal 2013, we experienced a continuation of many of the macroeconomic challenges we faced in EMEA in fiscal 2012.
While we did see some improvements in most of the European economy as the fiscal year progressed, we continued to see
weakness in southern Europe throughout fiscal 2013. For fiscal 2013, as compared with fiscal 2012, product revenue in the
EMEA segment was flat, as growth in the commercial, service provider and public sector markets was offset by a decline in
the enterprise market. The growth in product revenue in the service provider market was due to our acquisition of NDS at the
beginning of fiscal 2013. From a country perspective, product revenue increased by 1% in the United Kingdom, 11% in
Russia, 4% in Switzerland, and 3% in Spain. These increases were offset by product revenue declines of 3% in each of
Germany and France and 13% in the Netherlands. Product revenue for Italy was flat year over year.
47