Cisco 2013 Annual Report Download - page 51
Download and view the complete annual report
Please find page 51 of the 2013 Cisco annual report below. You can navigate through the pages in the report by either clicking on the pages listed below, or by using the keyword search tool below to find specific information within the annual report.-
 1
1 -
2
-
3
-
4
-
5
-
6
-
7
-
8
-
9
-
10
-
11
-
12
-
13
-
14
-
15
-
16
-
17
-
18
-
19
-
20
-
21
-
22
-
23
-
24
-
25
-
26
-
27
-
28
-
29
-
30
-
31
-
32
-
33
-
34
-
35
-
36
-
37
-
38
-
39
-
40
-
 41
41 -
 42
42 -
 43
43 -
 44
44 -
 45
45 -
 46
46 -
 47
47 -
 48
48 -
 49
49 -
 50
50 -
 51
51 -
 52
52 -
 53
53 -
 54
54 -
 55
55 -
 56
56 -
 57
57 -
 58
58 -
 59
59 -
 60
60 -
 61
61 -
62
-
63
-
64
-
65
-
66
-
67
-
68
-
69
-
70
-
71
-
72
-
73
-
74
-
75
-
76
-
77
-
78
-
79
-
80
-
81
-
82
-
83
-
84
-
85
-
86
-
87
-
88
-
89
-
90
-
91
-
92
-
93
-
94
-
95
-
96
-
97
-
98
-
99
-
100
-
101
-
102
-
103
-
104
-
105
-
106
-
107
-
108
-
109
-
110
-
111
-
112
-
113
-
114
-
115
-
116
-
117
-
118
-
119
-
120
-
121
-
122
-
123
-
124
-
125
-
126
-
127
-
128
-
129
-
130
-
131
-
132
-
133
-
134
-
135
-
136
-
137
-
138
-
139
-
140
 |
 |
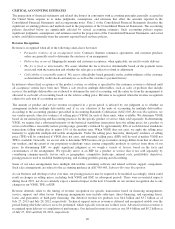
Fair Value Measurements
Our fixed income and publicly traded equity securities, collectively, are reflected in the Consolidated Balance Sheets at a fair value of
$42.7 billion as of July 27, 2013, compared with $38.9 billion as of July 28, 2012. Our fixed income investment portfolio, as of
July 27, 2013, consisted primarily of high quality investment-grade securities. See Note 8 to the Consolidated Financial Statements.
As described more fully in Note 2 to the Consolidated Financial Statements, a valuation hierarchy is based on the level of
independent, objective evidence available regarding the value of the investments. It encompasses three classes of investments:
Level 1 consists of securities for which there are quoted prices in active markets for identical securities; Level 2 consists of
securities for which observable inputs other than Level 1 inputs are used, such as quoted prices for similar securities in active
markets or quoted prices for identical securities in less active markets and model-derived valuations for which the variables are
derived from, or corroborated by, observable market data; and Level 3 consists of securities for which there are unobservable
inputs to the valuation methodology that are significant to the measurement of the fair value.
Our Level 2 securities are valued using quoted market prices for similar instruments or nonbinding market prices that are
corroborated by observable market data. We use inputs such as actual trade data, benchmark yields, broker/dealer quotes, and
other similar data, which are obtained from independent pricing vendors, quoted market prices, or other sources to determine
the ultimate fair value of our assets and liabilities. We use such pricing data as the primary input, to which we have not made
any material adjustments during fiscal 2013 and 2012, to make our assessments and determinations as to the ultimate valuation
of our investment portfolio. We are ultimately responsible for the financial statements and underlying estimates.
The inputs and fair value are reviewed for reasonableness, may be further validated by comparison to publicly available information, and
could be adjusted based on market indices or other information that management deems material to its estimate of fair value. The
assessment of fair value can be difficult and subjective. However, given the relative reliability of the inputs we use to value our
investment portfolio, and because substantially all of our valuation inputs are obtained using quoted market prices for similar or identical
assets, we do not believe that the nature of estimates and assumptions affected by levels of subjectivity and judgment was material to the
valuation of the investment portfolio as of July 27, 2013. We had no Level 3 investments in our total portfolio as of July 27, 2013.
Other-than-Temporary Impairments
We recognize an impairment charge when the declines in the fair values of our fixed income or publicly traded equity
securities below their cost basis are judged to be other than temporary. The ultimate value realized on these securities, to the
extent unhedged, is subject to market price volatility until they are sold.
If the fair value of a debt security is less than its amortized cost, we assess whether the impairment is other than temporary. An
impairment is considered other than temporary if (i) we have the intent to sell the security, (ii) it is more likely than not that we will be
required to sell the security before recovery of its entire amortized cost basis, or (iii) we do not expect to recover the entire amortized
cost of the security. If an impairment is considered other than temporary based on (i) or (ii) described in the prior sentence, the entire
difference between the amortized cost and the fair value of the security is recognized in earnings. If an impairment is considered other
than temporary based on condition (iii), the amount representing credit loss, defined as the difference between the present value of the
cash flows expected to be collected and the amortized cost basis of the debt security, will be recognized in earnings, and the amount
relating to all other factors will be recognized in other comprehensive income (OCI). In estimating the amount and timing of cash
flows expected to be collected, we consider all available information, including past events, current conditions, the remaining payment
terms of the security, the financial condition of the issuer, expected defaults, and the value of underlying collateral.
For publicly traded equity securities, we consider various factors in determining whether we should recognize an impairment
charge, including the length of time and extent to which the fair value has been less than our cost basis, the financial condition
and near-term prospects of the issuer, and our intent and ability to hold the investment for a period of time sufficient to allow
for any anticipated recovery in market value.
Impairment charges on our investments in publicly traded equity securities were not material in fiscal 2013, 2012, and 2011.
There were no impairment charges on investments in fixed income securities in fiscal 2013, 2012, and 2011. Our ongoing
consideration of all the factors described previously could result in additional impairment charges in the future, which could
adversely affect our net income.
We also have investments in privately held companies, some of which are in the startup or development stages. As of July 27,
2013, our investments in privately held companies were $833 million, compared with $858 million as of July 28, 2012, and
were included in other assets. We monitor these investments for events or circumstances indicative of potential impairment and
will make appropriate reductions in carrying values if we determine that an impairment charge is required, based primarily on
the financial condition and near-term prospects of these companies. These investments are inherently risky because the markets
for the technologies or products these companies are developing are typically in the early stages and may never materialize. Our
impairment charges on investments in privately held companies were $33 million, $23 million, and $10 million in fiscal 2013,
2012, and 2011, respectively.
43