Cisco 2013 Annual Report Download - page 71
Download and view the complete annual report
Please find page 71 of the 2013 Cisco annual report below. You can navigate through the pages in the report by either clicking on the pages listed below, or by using the keyword search tool below to find specific information within the annual report.-
 1
1 -
2
-
3
-
4
-
5
-
6
-
7
-
8
-
9
-
10
-
11
-
12
-
13
-
14
-
15
-
16
-
17
-
18
-
19
-
20
-
21
-
22
-
23
-
24
-
25
-
26
-
27
-
28
-
29
-
30
-
31
-
32
-
33
-
34
-
35
-
36
-
37
-
38
-
39
-
40
-
41
-
42
-
43
-
44
-
45
-
46
-
47
-
48
-
49
-
50
-
51
-
52
-
53
-
54
-
55
-
56
-
57
-
58
-
59
-
60
-
 61
61 -
 62
62 -
 63
63 -
 64
64 -
 65
65 -
 66
66 -
 67
67 -
 68
68 -
 69
69 -
 70
70 -
 71
71 -
 72
72 -
 73
73 -
 74
74 -
 75
75 -
 76
76 -
 77
77 -
 78
78 -
 79
79 -
 80
80 -
 81
81 -
82
-
83
-
84
-
85
-
86
-
87
-
88
-
89
-
90
-
91
-
92
-
93
-
94
-
95
-
96
-
97
-
98
-
99
-
100
-
101
-
102
-
103
-
104
-
105
-
106
-
107
-
108
-
109
-
110
-
111
-
112
-
113
-
114
-
115
-
116
-
117
-
118
-
119
-
120
-
121
-
122
-
123
-
124
-
125
-
126
-
127
-
128
-
129
-
130
-
131
-
132
-
133
-
134
-
135
-
136
-
137
-
138
-
139
-
140
 |
 |

We consider free cash flow to be a liquidity measure that provides useful information to management and investors because of
our intent to return a stated percentage of free cash flow to shareholders in the form of dividends and stock repurchases. We
further regard free cash flow as a useful measure because it reflects cash that can be used to, among other things, invest in our
business, make strategic acquisitions, repurchase common stock, and pay dividends on our common stock, after deducting
capital investments. A limitation of the utility of free cash flow as a measure of financial performance and liquidity is that the
free cash flow does not represent the total increase or decrease in our cash balance for the period. In addition, we have other
required uses of cash, including repaying the principal of our outstanding indebtedness. Free cash flow is not a measure
calculated in accordance with U.S. generally accepted accounting principles and should not be regarded in isolation or as an
alternative for net income provided by operating activities or any other measure calculated in accordance with such principles,
and other companies may calculate free cash flow in a different manner than we do.
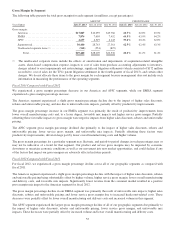
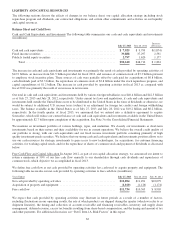
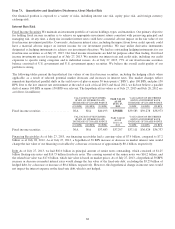
The following table summarizes the dividends paid and stock repurchases (in millions, except per-share amounts):
DIVIDENDS STOCK REPURCHASE PROGRAM TOTAL
Years Ended Per Share Amount Shares
Weighted-Average
Price per Share Amount Amount
July 27, 2013 ....................................... $0.62 $3,310 128 $21.63 $2,773 $6,083
July 28, 2012 ........................................ $0.28 $1,501 262 $16.64 $4,360 $5,861
July 30, 2011 ........................................ $0.12 $ 658 351 $19.36 $6,791 $7,449
On September 3, 2013, our Board of Directors declared a quarterly dividend of $0.17 per common share to be paid on
October 23, 2013 to all shareholders of record as of the close of business on October 3, 2013.
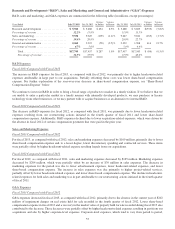
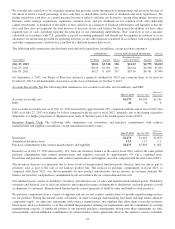
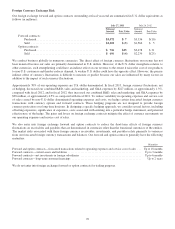
Accounts Receivable, Net The following table summarizes our accounts receivable, net (in millions), and DSO:
July 27, 2013 July 28, 2012
Increase
(Decrease)
Accounts receivable, net ................................................... $5,470 $4,369 $1,101
DSO ................................................................... 40 34 6
Our accounts receivable net, as of July 27, 2013 increased by approximately 25% compared with the end of fiscal 2012. Our
DSO as of July 27, 2013 was higher by 6 days compared with the end of fiscal 2012, primarily due to the timing of product
shipments, as a higher proportion of shipments were made in the latter part of the fourth quarter in fiscal 2013.
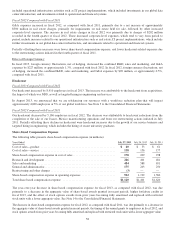
Inventory Supply Chain The following table summarizes our inventories and purchase commitments with contract
manufacturers and suppliers (in millions, except annualized inventory turns):
July 27, 2013 July 28, 2012
Increase
(Decrease)
Inventories .............................................................. $1,476 $1,663 $(187)
Annualized inventory turns ................................................. 13.8 11.7 2.1
Purchase commitments with contract manufacturers and suppliers .................. $4,033 $3,869 $ 164
Inventory as of July 27, 2013 decreased by 11% from our inventory balance at the end of fiscal 2012, and for the same period
purchase commitments with contract manufacturers and suppliers increased by approximately 4%. On a combined basis,
inventories and purchase commitments with contract manufacturers and suppliers were flat compared with the end of fiscal 2012.
The inventory decrease was primarily due to lower levels of manufactured finished goods, which in turn was due in part to
inventory sold as part of the sale of our Linksys product line. The increase in purchase commitments in fiscal 2013, as
compared with fiscal 2012, was driven primarily by new product introductions and an increase in customer demand. We
believe our inventory and purchase commitments levels are in line with our current demand forecasts.
Our finished goods consist of distributor inventory and deferred cost of sales and manufactured finished goods. Distributor
inventory and deferred cost of sales are related to unrecognized revenue on shipments to distributors and retail partners as well
as shipments to customers. Manufactured finished goods consist primarily of build-to-order and build-to-stock products.
We purchase components from a variety of suppliers and use several contract manufacturers to provide manufacturing services
for our products. During the normal course of business, in order to manage manufacturing lead times and help ensure adequate
component supply, we enter into agreements with contract manufacturers and suppliers that allow them to procure inventory
based upon criteria as defined by us or that establish the parameters defining our requirements and our commitment to securing
manufacturing capacity. A significant portion of our reported purchase commitments arising from these agreements are firm,
noncancelable, and unconditional commitments. In certain instances, these agreements allow us the option to cancel, reschedule,
63