Cisco 2013 Annual Report Download - page 49
Download and view the complete annual report
Please find page 49 of the 2013 Cisco annual report below. You can navigate through the pages in the report by either clicking on the pages listed below, or by using the keyword search tool below to find specific information within the annual report.-
 1
1 -
2
-
3
-
4
-
5
-
6
-
7
-
8
-
9
-
10
-
11
-
12
-
13
-
14
-
15
-
16
-
17
-
18
-
19
-
20
-
21
-
22
-
23
-
24
-
25
-
26
-
27
-
28
-
29
-
30
-
31
-
32
-
33
-
34
-
35
-
36
-
37
-
38
-
 39
39 -
 40
40 -
 41
41 -
 42
42 -
 43
43 -
 44
44 -
 45
45 -
 46
46 -
 47
47 -
 48
48 -
 49
49 -
 50
50 -
 51
51 -
 52
52 -
 53
53 -
 54
54 -
 55
55 -
 56
56 -
 57
57 -
 58
58 -
 59
59 -
60
-
61
-
62
-
63
-
64
-
65
-
66
-
67
-
68
-
69
-
70
-
71
-
72
-
73
-
74
-
75
-
76
-
77
-
78
-
79
-
80
-
81
-
82
-
83
-
84
-
85
-
86
-
87
-
88
-
89
-
90
-
91
-
92
-
93
-
94
-
95
-
96
-
97
-
98
-
99
-
100
-
101
-
102
-
103
-
104
-
105
-
106
-
107
-
108
-
109
-
110
-
111
-
112
-
113
-
114
-
115
-
116
-
117
-
118
-
119
-
120
-
121
-
122
-
123
-
124
-
125
-
126
-
127
-
128
-
129
-
130
-
131
-
132
-
133
-
134
-
135
-
136
-
137
-
138
-
139
-
140
 |
 |

We make sales to distributors which we refer to as two-tier systems of sales to the end customer. Revenue from distributors is
recognized based on a sell-through method using information provided by them. Our distributors participate in various
cooperative marketing and other programs, and we maintain estimated accruals and allowances for these programs. If actual
credits received by our distributors under these programs were to deviate significantly from our estimates, which are based on
historical experience, our revenue could be adversely affected.
Allowances for Receivables and Sales Returns
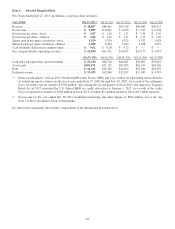
The allowances for receivables were as follows (in millions, except percentages):
July 27, 2013 July 28, 2012
Allowance for doubtful accounts ............................ $228 $207
Percentage of gross accounts receivable ..................... 4.0% 4.5%
Allowance for credit loss—lease receivables .................. $238 $247
Percentage of gross lease receivables ........................ 6.3% 7.2%
Allowance for credit loss—loan receivables ................... $86 $122
Percentage of gross loan receivables ........................ 5.2% 6.8%
The allowance for doubtful accounts is based on our assessment of the collectibility of customer accounts. We regularly
review the adequacy of these allowances by considering internal factors such as historical experience, credit quality and age of
the receivable balances, as well as external factors such as economic conditions that may affect a customer’s ability to pay and
expected default frequency rates, which are published by major third-party credit-rating agencies and are generally updated on
a quarterly basis. We also consider the concentration of receivables outstanding with a particular customer in assessing the
adequacy of our allowances for doubtful accounts. If a major customer’s creditworthiness deteriorates, if actual defaults are
higher than our historical experience, or if other circumstances arise, our estimates of the recoverability of amounts due to us
could be overstated, and additional allowances could be required, which could have an adverse impact on our operating results.
The allowance for credit loss on financing receivables is also based on the assessment of collectibility of customer accounts.
We regularly review the adequacy of the credit allowances determined either on an individual or a collective basis. When
evaluating the financing receivables on an individual basis, we consider historical experience, credit quality and age of
receivable balances, and economic conditions that may affect a customer’s ability to pay. When evaluating financing
receivables on a collective basis, we use expected default frequency rates published by a major third-party credit-rating agency
as well as our own historical loss rate in the event of default, while also systematically giving effect to economic conditions,
concentration of risk and correlation. Determining expected default frequency rates and loss factors associated with internal
credit risk ratings, as well as assessing factors such as economic conditions, concentration of risk, and correlation, are complex
and subjective. Our ongoing consideration of all these factors could result in an increase in our allowance for credit loss in the
future, which could adversely affect our operating results.
Both accounts receivable and financing receivables are charged off at the point when they are considered uncollectible.
A reserve for future sales returns is established based on historical trends in product return rates. The reserve for future sales
returns as of July 27, 2013 and July 28, 2012 was $119 million and $129 million, respectively, and was recorded as a reduction
of our accounts receivable. If the actual future returns were to deviate from the historical data on which the reserve had been
established, our revenue could be adversely affected.
Inventory Valuation and Liability for Purchase Commitments with Contract Manufacturers and Suppliers
Our inventory balance was $1.5 billion and $1.7 billion as of July 27, 2013 and July 28, 2012, respectively. Inventory is
written down based on excess and obsolete inventories, determined primarily by future demand forecasts. Inventory write-
downs are measured as the difference between the cost of the inventory and market, based upon assumptions about future
demand, and are charged to the provision for inventory, which is a component of our cost of sales. At the point of the loss
recognition, a new, lower cost basis for that inventory is established, and subsequent changes in facts and circumstances do not
result in the restoration or increase in that newly established cost basis.
We record a liability for firm, noncancelable, and unconditional purchase commitments with contract manufacturers and
suppliers for quantities in excess of our future demand forecasts consistent with the valuation of our excess and obsolete
inventory. As of July 27, 2013, the liability for these purchase commitments was $172 million, compared with $193 million as
of July 28, 2012, and was included in other current liabilities.
41