Cisco 2013 Annual Report Download - page 127
Download and view the complete annual report
Please find page 127 of the 2013 Cisco annual report below. You can navigate through the pages in the report by either clicking on the pages listed below, or by using the keyword search tool below to find specific information within the annual report.-
 1
1 -
2
-
3
-
4
-
5
-
6
-
7
-
8
-
9
-
10
-
11
-
12
-
13
-
14
-
15
-
16
-
17
-
18
-
19
-
20
-
21
-
22
-
23
-
24
-
25
-
26
-
27
-
28
-
29
-
30
-
31
-
32
-
33
-
34
-
35
-
36
-
37
-
38
-
39
-
40
-
41
-
42
-
43
-
44
-
45
-
46
-
47
-
48
-
49
-
50
-
51
-
52
-
53
-
54
-
55
-
56
-
57
-
58
-
59
-
60
-
61
-
62
-
63
-
64
-
65
-
66
-
67
-
68
-
69
-
70
-
71
-
72
-
73
-
74
-
75
-
76
-
77
-
78
-
79
-
80
-
81
-
82
-
83
-
84
-
85
-
86
-
87
-
88
-
89
-
90
-
91
-
92
-
93
-
94
-
95
-
96
-
97
-
98
-
99
-
100
-
101
-
102
-
103
-
104
-
105
-
106
-
107
-
108
-
109
-
110
-
111
-
112
-
113
-
114
-
115
-
116
-
 117
117 -
 118
118 -
 119
119 -
 120
120 -
 121
121 -
 122
122 -
 123
123 -
 124
124 -
 125
125 -
 126
126 -
 127
127 -
 128
128 -
 129
129 -
 130
130 -
 131
131 -
 132
132 -
 133
133 -
 134
134 -
 135
135 -
 136
136 -
 137
137 -
138
-
139
-
140
 |
 |

16. Segment Information and Major Customers
(a) Revenue and Gross Margin by Segment
The Company conducts business globally and is primarily managed on a geographic basis consisting of three segments: the
Americas; EMEA; and APJC. The Company’s management makes financial decisions and allocates resources based on the
information it receives from its internal management system. Sales are attributed to a segment based on the ordering location
of the customer. The Company does not allocate research and development, sales and marketing, or general and administrative
expenses to its segments in this internal management system because management does not include the information in its
measurement of the performance of the operating segments. In addition, the Company does not allocate amortization and
impairment of acquisition-related intangible assets, share-based compensation expense, impacts to cost of sales from purchase
accounting adjustments to inventory, charges related to asset impairments and restructurings, significant litigation settlements,
and other charges to the gross margin for each segment because management does not include this information in its
measurement of the performance of the operating segments.
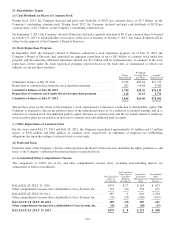
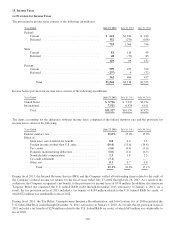
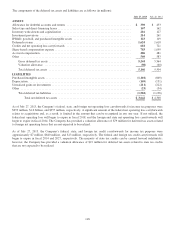
Summarized financial information by segment for fiscal 2013, 2012, and 2011, based on the Company’s internal management
system and as utilized by the Company’s Chief Operating Decision Maker (“CODM”), is as follows (in millions):
Years Ended July 27, 2013 July 28, 2012 July 30, 2011
Revenue:
Americas ....................................... $28,639 $26,501 $25,015
EMEA ......................................... 12,210 12,075 11,604
APJC .......................................... 7,758 7,485 6,599
Total ...................................... $48,607 $46,061 $43,218
Gross margin:
Americas ....................................... $17,887 $16,639 $15,766
EMEA ......................................... 7,876 7,605 7,452
APJC .......................................... 4,637 4,519 4,143
Segment total ............................... 30,400 28,763 27,361
Unallocated corporate items ............................ (960) (554) (825)
Total ...................................... $29,440 $28,209 $26,536
Revenue in the United States, which is included in the Americas, was $24.6 billion, $22.6 billion, and $21.5 billion for fiscal
2013, 2012, and 2011, respectively.
(b) Revenue for Groups of Similar Products and Services
The Company designs, manufactures, and sells Internet Protocol IP-based networking and other products related to the
communications and IT industry, and provides services associated with these products and their use. The Company groups its
products and technologies into the following categories: Switching, NGN Routing, Service Provider Video, Collaboration,
Wireless, Data Center, Security, and Other Products. These products, primarily integrated by Cisco IOS Software, link
geographically dispersed local-area networks (LANs), metropolitan-area networks (MANs), and wide-area networks (WANs).
The Company has made certain reclassifications to the prior period amounts to conform to the current year’s presentation.
119