Cisco 2013 Annual Report Download - page 107
Download and view the complete annual report
Please find page 107 of the 2013 Cisco annual report below. You can navigate through the pages in the report by either clicking on the pages listed below, or by using the keyword search tool below to find specific information within the annual report.-
 1
1 -
2
-
3
-
4
-
5
-
6
-
7
-
8
-
9
-
10
-
11
-
12
-
13
-
14
-
15
-
16
-
17
-
18
-
19
-
20
-
21
-
22
-
23
-
24
-
25
-
26
-
27
-
28
-
29
-
30
-
31
-
32
-
33
-
34
-
35
-
36
-
37
-
38
-
39
-
40
-
41
-
42
-
43
-
44
-
45
-
46
-
47
-
48
-
49
-
50
-
51
-
52
-
53
-
54
-
55
-
56
-
57
-
58
-
59
-
60
-
61
-
62
-
63
-
64
-
65
-
66
-
67
-
68
-
69
-
70
-
71
-
72
-
73
-
74
-
75
-
76
-
77
-
78
-
79
-
80
-
81
-
82
-
83
-
84
-
85
-
86
-
87
-
88
-
89
-
90
-
91
-
92
-
93
-
94
-
95
-
96
-
 97
97 -
 98
98 -
 99
99 -
 100
100 -
 101
101 -
 102
102 -
 103
103 -
 104
104 -
 105
105 -
 106
106 -
 107
107 -
 108
108 -
 109
109 -
 110
110 -
 111
111 -
 112
112 -
 113
113 -
 114
114 -
 115
115 -
 116
116 -
 117
117 -
118
-
119
-
120
-
121
-
122
-
123
-
124
-
125
-
126
-
127
-
128
-
129
-
130
-
131
-
132
-
133
-
134
-
135
-
136
-
137
-
138
-
139
-
140
 |
 |

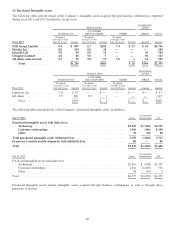
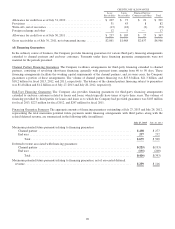
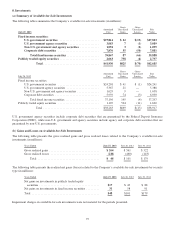
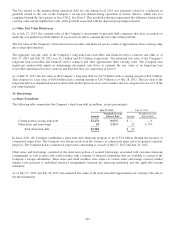
(d) Securities Lending
The Company periodically engages in securities lending activities with certain of its available-for-sale investments. These
transactions are accounted for as a secured lending of the securities, and the securities are typically loaned only on an
overnight basis. The average daily balance of securities lending for fiscal 2013 and 2012 was $0.7 billion and $0.5 billion,
respectively. The Company requires collateral equal to at least 102% of the fair market value of the loaned security in the form
of cash or liquid, high-quality assets. The Company engages in these secured lending transactions only with highly
creditworthy counterparties, and the associated portfolio custodian has agreed to indemnify the Company against collateral
losses. The Company did not experience any losses in connection with the secured lending of securities during the periods
presented. As of July 27, 2013 and July 28, 2012, the Company had no outstanding securities lending transactions.
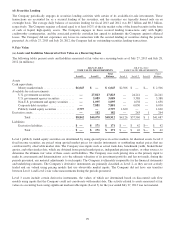
9. Fair Value
(a) Assets and Liabilities Measured at Fair Value on a Recurring Basis
The following tables present assets and liabilities measured at fair value on a recurring basis as of July 27, 2013 and July 28,
2012 (in millions):
JULY 27, 2013
FAIR VALUE MEASUREMENTS
JULY 28, 2012
FAIR VALUE MEASUREMENTS
Level 1 Level 2
Total
Balance Level 1 Level 2 Level 3
Total
Balance
Assets
Cash equivalents:
Money market funds ..................... $6,045 $ — $ 6,045 $2,506 $ — $— $ 2,506
Available-for-sale investments:
U.S. government securities ................ — 27,823 27,823 — 24,241 — 24,241
U.S. government agency securities ......... — 3,089 3,089 — 5,388 — 5,388
Non-U.S. government and agency securities .... — 1,095 1,095 — 1,638 — 1,638
Corporate debt securities ................. — 7,881 7,881 — 6,030 — 6,030
Publicly traded equity securities ............ 2,797 — 2,797 1,620 — — 1,620
Derivative assets ............................ — 182 182 — 263 1 264
Total ............................. $8,842 $40,070 $48,912 $4,126 $37,560 $ 1 $41,687
Liabilities:
Derivative liabilities ..................... $ — $ 171 $ 171 $— $ 42 $— $ 42
Total ............................. $ — $ 171 $ 171 $— $ 42 $— $ 42
Level 1 publicly traded equity securities are determined by using quoted prices in active markets for identical assets. Level 2
fixed income securities are priced using quoted market prices for similar instruments or nonbinding market prices that are
corroborated by observable market data. The Company uses inputs such as actual trade data, benchmark yields, broker/dealer
quotes, and other similar data, which are obtained from quoted market prices, independent pricing vendors, or other sources, to
determine the ultimate fair value of these assets and liabilities. The Company uses such pricing data as the primary input to
make its assessments and determinations as to the ultimate valuation of its investment portfolio and has not made, during the
periods presented, any material adjustments to such inputs. The Company is ultimately responsible for the financial statements
and underlying estimates. The Company’s derivative instruments are primarily classified as Level 2, as they are not actively
traded and are valued using pricing models that use observable market inputs. The Company did not have any transfers
between Level 1 and Level 2 fair value measurements during the periods presented.
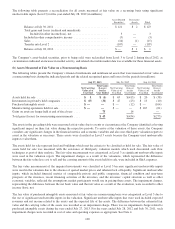
Level 3 assets include certain derivative instruments, the values of which are determined based on discounted cash flow
models using inputs that the Company could not corroborate with market data. The activity related to assets measured at fair
value on a recurring basis using significant unobservable inputs (Level 3) for the year ended July 27, 2013 was not material.
99