Cisco 2013 Annual Report Download - page 122
Download and view the complete annual report
Please find page 122 of the 2013 Cisco annual report below. You can navigate through the pages in the report by either clicking on the pages listed below, or by using the keyword search tool below to find specific information within the annual report.-
 1
1 -
2
-
3
-
4
-
5
-
6
-
7
-
8
-
9
-
10
-
11
-
12
-
13
-
14
-
15
-
16
-
17
-
18
-
19
-
20
-
21
-
22
-
23
-
24
-
25
-
26
-
27
-
28
-
29
-
30
-
31
-
32
-
33
-
34
-
35
-
36
-
37
-
38
-
39
-
40
-
41
-
42
-
43
-
44
-
45
-
46
-
47
-
48
-
49
-
50
-
51
-
52
-
53
-
54
-
55
-
56
-
57
-
58
-
59
-
60
-
61
-
62
-
63
-
64
-
65
-
66
-
67
-
68
-
69
-
70
-
71
-
72
-
73
-
74
-
75
-
76
-
77
-
78
-
79
-
80
-
81
-
82
-
83
-
84
-
85
-
86
-
87
-
88
-
89
-
90
-
91
-
92
-
93
-
94
-
95
-
96
-
97
-
98
-
99
-
100
-
101
-
102
-
103
-
104
-
105
-
106
-
107
-
108
-
109
-
110
-
111
-
 112
112 -
 113
113 -
 114
114 -
 115
115 -
 116
116 -
 117
117 -
 118
118 -
 119
119 -
 120
120 -
 121
121 -
 122
122 -
 123
123 -
 124
124 -
 125
125 -
 126
126 -
 127
127 -
 128
128 -
 129
129 -
 130
130 -
 131
131 -
 132
132 -
133
-
134
-
135
-
136
-
137
-
138
-
139
-
140
 |
 |

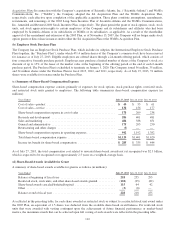
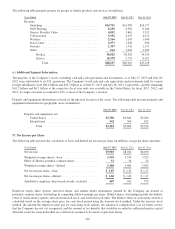
The following table summarizes significant ranges of outstanding and exercisable stock options as of July 27, 2013 (in
millions, except years and share prices):
STOCK OPTIONS OUTSTANDING STOCK OPTIONS EXERCISABLE
Range of Exercise Prices
Number
Outstanding
Weighted-
Average
Remaining
Contractual
Life
(in Years)
Weighted-
Average
Exercise
Price per
Share
Aggregate
Intrinsic
Value
Number
Exercisable
Weighted-
Average
Exercise
Price per
Share
Aggregate
Intrinsic
Value
$ 0.01 – 15.00 ......................... 9 6.18 $ 3.99 $198 5 $ 7.00 $ 84
15.01 – 18.00 ......................... 40 1.20 17.79 308 40 17.79 307
18.01 – 20.00 ......................... 25 0.68 19.15 155 24 19.15 155
20.01 – 25.00 ......................... 86 2.22 22.82 231 86 22.82 231
25.01 – 35.00 ......................... 116 3.12 30.69 — 116 30.69 —
Total .............................. 276 2.45 $24.44 $892 271 $24.84 $777
The aggregate intrinsic value in the preceding table represents the total pretax intrinsic value, based on the Company’s closing
stock price of $25.50 as of July 26, 2013, that would have been received by the option holders had those option holders
exercised their stock options as of that date. The total number of in-the-money stock options exercisable as of July 27, 2013
was 155 million. As of July 28, 2012, 512 million outstanding stock options were exercisable and the weighted-average
exercise price was $22.65.
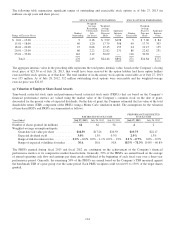
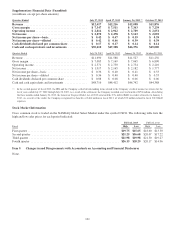
(g) Valuation of Employee Share-Based Awards
Time-based restricted stock units and performance-based restricted stock units (PRSUs) that are based on the Company’s
financial performance metrics are valued using the market value of the Company’s common stock on the date of grant,
discounted for the present value of expected dividends. On the date of grant, the Company estimated the fair value of the total
shareholder return (TSR) component of the PRSUs using a Monte Carlo simulation model. The assumptions for the valuation
of time-based RSUs and PRSUs are summarized as follows:
RESTRICTED STOCK UNITS
PERFORMANCE RESTRICTED
STOCK UNITS
Years Ended July 27, 2013 July 28, 2012 July 30, 2011 July 27, 2013 July 28, 2012
Number of shares granted (in millions) ........ 64 62 54 42
Weighted-average assumptions/inputs:
Grant date fair value per share ........... $18.39 $17.26 $20.59 $19.73 $22.17
Expected dividend yield ................ 3.0% 1.5% 0.3% 2.9% 1.3%
Range of risk-free interest rates ............ 0.0% – 1.1% 0.0% – 1.1% 0.0% – 1.9% 0.1% – 0.7% 0.0% – 0.9%
Range of expected volatilities for index .... N/A N/A N/A 18.3% – 78.3% 19.8% – 60.8%
The PRSUs granted during fiscal 2013 and fiscal 2012 are contingent on the achievement of the Company’s financial
performance metrics or its comparative market-based returns. Generally, 50% of the PRSUs are earned based on the average
of annual operating cash flow and earnings per share goals established at the beginning of each fiscal year over a three-year
performance period. Generally, the remaining 50% of the PRSUs are earned based on the Company’s TSR measured against
the benchmark TSR of a peer group over the same period. Each PRSU recipient could vest in 0% to 150% of the target shares
granted.
114