Cisco 2013 Annual Report Download - page 65
Download and view the complete annual report
Please find page 65 of the 2013 Cisco annual report below. You can navigate through the pages in the report by either clicking on the pages listed below, or by using the keyword search tool below to find specific information within the annual report.-
 1
1 -
2
-
3
-
4
-
5
-
6
-
7
-
8
-
9
-
10
-
11
-
12
-
13
-
14
-
15
-
16
-
17
-
18
-
19
-
20
-
21
-
22
-
23
-
24
-
25
-
26
-
27
-
28
-
29
-
30
-
31
-
32
-
33
-
34
-
35
-
36
-
37
-
38
-
39
-
40
-
41
-
42
-
43
-
44
-
45
-
46
-
47
-
48
-
49
-
50
-
51
-
52
-
53
-
54
-
 55
55 -
 56
56 -
 57
57 -
 58
58 -
 59
59 -
 60
60 -
 61
61 -
 62
62 -
 63
63 -
 64
64 -
 65
65 -
 66
66 -
 67
67 -
 68
68 -
 69
69 -
 70
70 -
 71
71 -
 72
72 -
 73
73 -
 74
74 -
 75
75 -
76
-
77
-
78
-
79
-
80
-
81
-
82
-
83
-
84
-
85
-
86
-
87
-
88
-
89
-
90
-
91
-
92
-
93
-
94
-
95
-
96
-
97
-
98
-
99
-
100
-
101
-
102
-
103
-
104
-
105
-
106
-
107
-
108
-
109
-
110
-
111
-
112
-
113
-
114
-
115
-
116
-
117
-
118
-
119
-
120
-
121
-
122
-
123
-
124
-
125
-
126
-
127
-
128
-
129
-
130
-
131
-
132
-
133
-
134
-
135
-
136
-
137
-
138
-
139
-
140
 |
 |

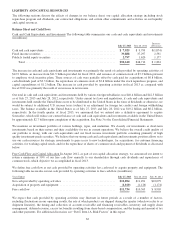
Research and Development (“R&D”), Sales and Marketing, and General and Administrative (“G&A”) Expenses
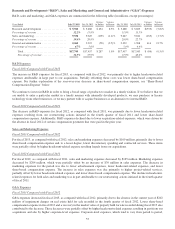
R&D, sales and marketing, and G&A expenses are summarized in the following table (in millions, except percentages):
Years Ended July 27, 2013 July 28, 2012
Variance
in Dollars
Variance
in Percent July 28, 2012 July 30, 2011
Variance
in Dollars
Variance
in Percent
Research and development .................. $ 5,942 $ 5,488 $ 454 8.3% $ 5,488 $ 5,823 $(335) (5.8)%
Percentage of revenue ...................... 12.2% 11.9% 11.9% 13.5%
Sales and marketing ........................ 9,538 9,647 (109) (1.1)% 9,647 9,812 (165) (1.7)%
Percentage of revenue ...................... 19.6% 20.9% 20.9% 22.7%
General and administrative .................. 2,264 2,322 (58) (2.5)% 2,322 1,908 414 21.7%
Percentage of revenue ...................... 4.7% 5.0% 5.0% 4.4%
Total ................................ $17,744 $17,457 $ 287 1.6% $17,457 $17,543 $ (86) (0.5)%
Percentage of revenue .................. 36.5% 37.9% 37.9% 40.6%
R&D Expenses
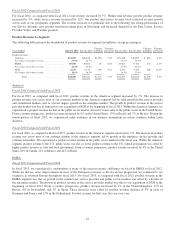
Fiscal 2013 Compared with Fiscal 2012
The increase in R&D expenses for fiscal 2013, as compared with fiscal 2012, was primarily due to higher headcount-related
expenses attributable in large part to our acquisitions. Partially offsetting these costs was lower share-based compensation
expense. For further explanation of the year-over-year decrease in share-based compensation expense, see “Share-Based
Compensation Expense” below.
We continue to invest in R&D in order to bring a broad range of products to market in a timely fashion. If we believe that we
are unable to enter a particular market in a timely manner with internally developed products, we may purchase or license
technology from other businesses, or we may partner with or acquire businesses as an alternative to internal R&D.
Fiscal 2012 Compared with Fiscal 2011
The decrease in R&D expenses for fiscal 2012, as compared with fiscal 2011, was primarily due to lower headcount-related
expenses resulting from our restructuring actions initiated in the fourth quarter of fiscal 2011 and lower share-based
compensation expense. Additionally, R&D expenses declined due to lower acquisition-related expenses, which were driven by
the absence in fiscal 2012 of certain compensation payments that were paid in the prior year.
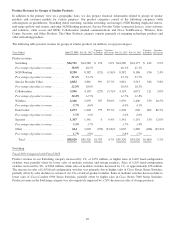
Sales and Marketing Expenses
Fiscal 2013 Compared with Fiscal 2012
For fiscal 2013, as compared with fiscal 2012, sales and marketing expenses decreased by $109 million, primarily due to lower
share-based compensation expense and, to a lesser degree, lower discretionary spending and contracted services. These items
were partially offset by higher headcount-related expense resulting largely from our acquisitions.
Fiscal 2012 Compared with Fiscal 2011
For fiscal 2012, as compared with fiscal 2011, sales and marketing expenses decreased by $165 million. Marketing expenses
decreased by $204 million, which were partially offset by an increase of $39 million in sales expenses. The decrease in
marketing expenses for the period was due to lower advertisement expenses, lower headcount-related expenses, and lower
share-based compensation expense. The increase in sales expenses was due primarily to higher project-related services,
partially offset by lower headcount-related expenses and lower share-based compensation expense. The decline in headcount-
related expenses for both sales and marketing was in part attributable to our restructuring actions initiated in the fourth quarter
of fiscal 2011.
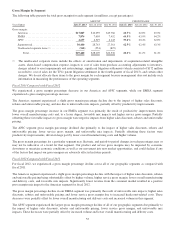
G&A Expenses
Fiscal 2013 Compared with Fiscal 2012
G&A expenses decreased in fiscal 2013, as compared with fiscal 2012, primarily due to the absence in the current year of $202
million of impairment charges on real estate held for sale recorded in the fourth quarter of fiscal 2012. Lower share-based
compensation expense in fiscal 2013 and a recovery in the market value of property held for sale recorded during fiscal 2013 also
contributed to the decrease. These decreases were partially offset by higher headcount-related expenses resulting in part from our
acquisitions and also by higher corporate-level expenses. Corporate-level expenses, which tend to vary from period to period,
57