Cisco 2013 Annual Report Download - page 50
Download and view the complete annual report
Please find page 50 of the 2013 Cisco annual report below. You can navigate through the pages in the report by either clicking on the pages listed below, or by using the keyword search tool below to find specific information within the annual report.-
 1
1 -
2
-
3
-
4
-
5
-
6
-
7
-
8
-
9
-
10
-
11
-
12
-
13
-
14
-
15
-
16
-
17
-
18
-
19
-
20
-
21
-
22
-
23
-
24
-
25
-
26
-
27
-
28
-
29
-
30
-
31
-
32
-
33
-
34
-
35
-
36
-
37
-
38
-
39
-
 40
40 -
 41
41 -
 42
42 -
 43
43 -
 44
44 -
 45
45 -
 46
46 -
 47
47 -
 48
48 -
 49
49 -
 50
50 -
 51
51 -
 52
52 -
 53
53 -
 54
54 -
 55
55 -
 56
56 -
 57
57 -
 58
58 -
 59
59 -
 60
60 -
61
-
62
-
63
-
64
-
65
-
66
-
67
-
68
-
69
-
70
-
71
-
72
-
73
-
74
-
75
-
76
-
77
-
78
-
79
-
80
-
81
-
82
-
83
-
84
-
85
-
86
-
87
-
88
-
89
-
90
-
91
-
92
-
93
-
94
-
95
-
96
-
97
-
98
-
99
-
100
-
101
-
102
-
103
-
104
-
105
-
106
-
107
-
108
-
109
-
110
-
111
-
112
-
113
-
114
-
115
-
116
-
117
-
118
-
119
-
120
-
121
-
122
-
123
-
124
-
125
-
126
-
127
-
128
-
129
-
130
-
131
-
132
-
133
-
134
-
135
-
136
-
137
-
138
-
139
-
140
 |
 |

Our provision for inventory was $114 million, $115 million, and $196 million for fiscal 2013, 2012, and 2011, respectively.
The provision for the liability related to purchase commitments with contract manufacturers and suppliers was $106 million,
$151 million, and $114 million in fiscal 2013, 2012, and 2011, respectively. The decrease in our provision for the liability
related to purchase commitments with contract manufacturers and suppliers for fiscal 2013 was primarily due to the increase in
demand for our products resulting in lower inventory levels with our contract manufacturers during fiscal 2013. If there were
to be a sudden and significant decrease in demand for our products, or if there were a higher incidence of inventory
obsolescence because of rapidly changing technology and customer requirements, we could be required to increase our
inventory write-downs, and our liability for purchase commitments with contract manufacturers and suppliers, and accordingly
our profitability, could be adversely affected. We regularly evaluate our exposure for inventory write-downs and the adequacy
of our liability for purchase commitments. Inventory and supply chain management remain areas of focus as we balance the
need to maintain supply chain flexibility to help ensure competitive lead times with the risk of inventory obsolescence,
particularly in light of current macroeconomic uncertainties and conditions and the resulting potential for changes in future
demand forecast.
Warranty Costs
The liability for product warranties, included in other current liabilities, was $431 million as of July 27, 2013, compared with
$415 million as of July 28, 2012. See Note 12 to the Consolidated Financial Statements. Our products are generally covered by
a warranty for periods ranging from 90 days to five years, and for some products we provide a limited lifetime warranty. We
accrue for warranty costs as part of our cost of sales based on associated material costs, technical support labor costs, and
associated overhead. Material cost is estimated based primarily upon historical trends in the volume of product returns within
the warranty period and the cost to repair or replace the equipment. Technical support labor cost is estimated based primarily
upon historical trends in the rate of customer cases and the cost to support the customer cases within the warranty period.
Overhead cost is applied based on estimated time to support warranty activities.
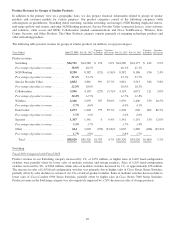
The provision for product warranties issued during fiscal 2013, 2012, and 2011 was $664 million, $661 million, and $456
million, respectively. If we experience an increase in warranty claims compared with our historical experience, or if the cost of
servicing warranty claims is greater than expected, our profitability could be adversely affected.
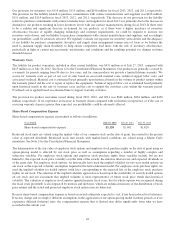
Share-Based Compensation Expense
Share-based compensation expense is presented as follows (in millions):
Years Ended July 27, 2013 July 28, 2012 July 30, 2011
Share-based compensation expense ...................... $1,120 $1,401 $1,620
Restricted stock units are valued using the market value of our common stock on the date of grant, discounted for the present
value of expected dividends. Restricted stock unit awards with market-based conditions are valued using a Monte Carlo
simulation. See Note 14 to the Consolidated Financial Statements.
The determination of the fair value of employee stock options and employee stock purchase rights on the date of grant using an
option-pricing model is affected by our stock price as well as assumptions regarding a number of highly complex and
subjective variables. For employee stock options and employee stock purchase rights, these variables include, but are not
limited to, the expected stock price volatility over the term of the awards, the risk-free interest rate, and expected dividends as
of the grant date. For employee stock options, we historically have used the implied volatility for two-year traded options on
our stock as the expected volatility assumption required in the lattice-binomial model. For employee stock purchase rights, we
used the implied volatility for traded options (with lives corresponding to the expected life of the employee stock purchase
rights) on our stock. The selection of the implied volatility approach was based upon the availability of actively traded options
on our stock and our assessment that implied volatility is more representative of future stock price trends than historical
volatility. The valuation of employee stock options (granted in prior fiscal years, but for which expense was recognized during
the fiscal years presented) is also impacted by kurtosis and skewness, which are technical measures of the distribution of stock
price returns and the actual and projected employee stock option exercise behaviors.
Because share-based compensation expense is based on awards ultimately expected to vest, it has been reduced for forfeitures.
If factors change and we employ different assumptions in the application of our option-pricing model in future periods or if we
experience different forfeiture rates, the compensation expense that is derived may differ significantly from what we have
recorded in the current year.
42