Cisco 2013 Annual Report Download - page 67
Download and view the complete annual report
Please find page 67 of the 2013 Cisco annual report below. You can navigate through the pages in the report by either clicking on the pages listed below, or by using the keyword search tool below to find specific information within the annual report.-
 1
1 -
2
-
3
-
4
-
5
-
6
-
7
-
8
-
9
-
10
-
11
-
12
-
13
-
14
-
15
-
16
-
17
-
18
-
19
-
20
-
21
-
22
-
23
-
24
-
25
-
26
-
27
-
28
-
29
-
30
-
31
-
32
-
33
-
34
-
35
-
36
-
37
-
38
-
39
-
40
-
41
-
42
-
43
-
44
-
45
-
46
-
47
-
48
-
49
-
50
-
51
-
52
-
53
-
54
-
55
-
56
-
 57
57 -
 58
58 -
 59
59 -
 60
60 -
 61
61 -
 62
62 -
 63
63 -
 64
64 -
 65
65 -
 66
66 -
 67
67 -
 68
68 -
 69
69 -
 70
70 -
 71
71 -
 72
72 -
 73
73 -
 74
74 -
 75
75 -
 76
76 -
 77
77 -
78
-
79
-
80
-
81
-
82
-
83
-
84
-
85
-
86
-
87
-
88
-
89
-
90
-
91
-
92
-
93
-
94
-
95
-
96
-
97
-
98
-
99
-
100
-
101
-
102
-
103
-
104
-
105
-
106
-
107
-
108
-
109
-
110
-
111
-
112
-
113
-
114
-
115
-
116
-
117
-
118
-
119
-
120
-
121
-
122
-
123
-
124
-
125
-
126
-
127
-
128
-
129
-
130
-
131
-
132
-
133
-
134
-
135
-
136
-
137
-
138
-
139
-
140
 |
 |

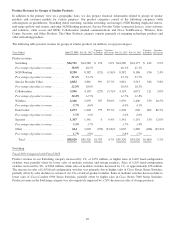
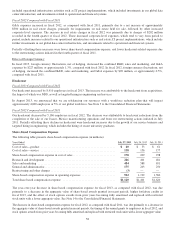
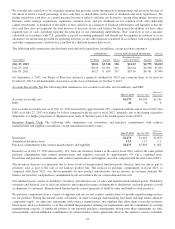
Amortization of Purchased Intangible Assets
The following table presents the amortization of purchased intangible assets included in operating expenses (in millions):
Years Ended July 27, 2013 July 28, 2012 July 30, 2011
Amortization of purchased intangible assets included in operating expenses .......... $395 $383 $520
The increase in amortization of purchased intangible assets for fiscal 2013, compared with fiscal 2012, was primarily due to
amortization of purchased intangible assets from our acquisition of NDS at the beginning of fiscal 2013 and from our other
fiscal 2013 acquisitions, partially offset by certain purchased intangible assets having become fully amortized during fiscal
2013. The decrease in amortization of purchased intangible assets for fiscal 2012, compared with fiscal 2011, was primarily
due to the absence of significant impairment charges during fiscal 2012 and also due to certain purchased intangible assets
having become fully amortized or impaired in fiscal 2011. The impairment charges in fiscal 2011 were primarily due to
declines in estimated fair value as a result of reductions in expected future cash flows associated with certain products from
our then consumer product lines. For additional information regarding purchased intangible assets, see Note 4 to the
Consolidated Financial Statements.
The fair value of acquired technology and patents, as well as acquired technology under development, is determined at
acquisition date primarily using the income approach, which discounts expected future cash flows to present value. The
discount rates used in the present value calculations are typically derived from a weighted-average cost of capital analysis and
then adjusted to reflect risks inherent in the development lifecycle as appropriate. We consider the pricing model for products
related to these acquisitions to be standard within the high-technology communications industry, and the applicable discount
rates represent the rates that market participants would use for valuation of such intangible assets.
Restructuring and Other Charges
Fiscal 2011 Plans
In connection with the Fiscal 2011 Plans (see Note 5 to the Consolidated Financial Statements), we incurred within operating
expenses net restructuring and other charges of approximately $105 million, $304 million, and $799 million for fiscal 2013,
2012, and 2011, respectively.
August Fiscal 2014 Plan
In August 2013, we announced a workforce reduction plan. We are rebalancing our resources with a workforce reduction plan
that will impact approximately 4,000 employees or 5% of our global workforce. We expect to take action under this plan
beginning in the first quarter of fiscal 2014. We currently estimate that we will recognize pretax charges to our financial
results in an amount not expected to exceed $550 million consisting of severance and other one-time termination benefits, and
other associated costs.
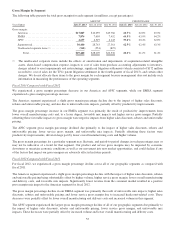
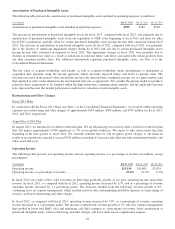
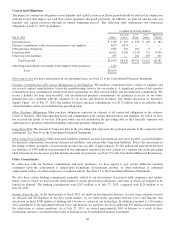
Operating Income
The following table presents our operating income and our operating income as a percentage of revenue (in millions, except
percentages):
Years Ended July 27, 2013 July 28, 2012 July 30, 2011
Operating income ........................................................ $11,196 $10,065 $7,674
Operating income as a percentage of revenue ................................... 23.0% 21.9% 17.8%
In fiscal 2013 our results reflect solid execution on delivering profitable growth, as we grew operating income faster than
revenue. In fiscal 2013, as compared with fiscal 2012, operating income increased by 11%, and as a percentage of revenue
operating income increased by 1.1 percentage points. The increases resulted from the following: revenue growth of 6%;
continuing focus on expense management, which resulted in lower sales and marketing and G&A expenses as a percentage of
revenue; and lower restructuring and other charges.
In fiscal 2012, as compared with fiscal 2011, operating income increased by 31%, as a percentage of revenue, operating
income increased by 4.1 percentage points. The increase resulted from: revenue growth of 7%; effective expense management
that resulted in lower total R&D, sales and marketing, and G&A expenses as a percentage of revenue; lower amortization of
purchased intangible assets; lower restructuring and other charges; and lower share-based compensation expense.
59