Cisco 2013 Annual Report Download - page 83
Download and view the complete annual report
Please find page 83 of the 2013 Cisco annual report below. You can navigate through the pages in the report by either clicking on the pages listed below, or by using the keyword search tool below to find specific information within the annual report.-
 1
1 -
2
-
3
-
4
-
5
-
6
-
7
-
8
-
9
-
10
-
11
-
12
-
13
-
14
-
15
-
16
-
17
-
18
-
19
-
20
-
21
-
22
-
23
-
24
-
25
-
26
-
27
-
28
-
29
-
30
-
31
-
32
-
33
-
34
-
35
-
36
-
37
-
38
-
39
-
40
-
41
-
42
-
43
-
44
-
45
-
46
-
47
-
48
-
49
-
50
-
51
-
52
-
53
-
54
-
55
-
56
-
57
-
58
-
59
-
60
-
61
-
62
-
63
-
64
-
65
-
66
-
67
-
68
-
69
-
70
-
71
-
72
-
 73
73 -
 74
74 -
 75
75 -
 76
76 -
 77
77 -
 78
78 -
 79
79 -
 80
80 -
 81
81 -
 82
82 -
 83
83 -
 84
84 -
 85
85 -
 86
86 -
 87
87 -
 88
88 -
 89
89 -
 90
90 -
 91
91 -
 92
92 -
 93
93 -
94
-
95
-
96
-
97
-
98
-
99
-
100
-
101
-
102
-
103
-
104
-
105
-
106
-
107
-
108
-
109
-
110
-
111
-
112
-
113
-
114
-
115
-
116
-
117
-
118
-
119
-
120
-
121
-
122
-
123
-
124
-
125
-
126
-
127
-
128
-
129
-
130
-
131
-
132
-
133
-
134
-
135
-
136
-
137
-
138
-
139
-
140
 |
 |

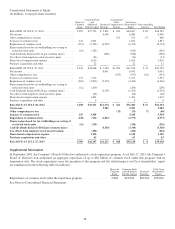
Consolidated Statements of Operations
(in millions, except per-share amounts)
Years Ended July 27, 2013 July 28, 2012 July 30, 2011
REVENUE:
Product ....................................................... $38,029 $36,326 $34,526
Service ....................................................... 10,578 9,735 8,692
Total revenue .............................................. 48,607 46,061 43,218
COST OF SALES:
Product ....................................................... 15,541 14,505 13,647
Service ....................................................... 3,626 3,347 3,035
Total cost of sales ........................................... 19,167 17,852 16,682
GROSS MARGIN ..................................................... 29,440 28,209 26,536
OPERATING EXPENSES:
Research and development ........................................ 5,942 5,488 5,823
Sales and marketing ............................................. 9,538 9,647 9,812
General and administrative ........................................ 2,264 2,322 1,908
Amortization of purchased intangible assets .......................... 395 383 520
Restructuring and other charges .................................... 105 304 799
Total operating expenses ..................................... 18,244 18,144 18,862
OPERATING INCOME ................................................ 11,196 10,065 7,674
Interest income ................................................. 654 650 641
Interest expense ................................................ (583) (596) (628)
Other income (loss), net .......................................... (40) 40 138
Interest and other income, net ................................. 31 94 151
INCOME BEFORE PROVISION FOR INCOME TAXES ................... 11,227 10,159 7,825
Provision for income taxes ................................................ 1,244 2,118 1,335
NET INCOME ................................................ $ 9,983 $ 8,041 $ 6,490
Net income per share:
Basic ............................................................. $ 1.87 $ 1.50 $ 1.17
Diluted ........................................................... $ 1.86 $ 1.49 $ 1.17
Shares used in per-share calculation:
Basic ............................................................. 5,329 5,370 5,529
Diluted ........................................................... 5,380 5,404 5,563
Cash dividends declared per common share .................................. $ 0.62 $ 0.28 $ 0.12
See Notes to Consolidated Financial Statements.
75