Cisco 2013 Annual Report Download - page 46
Download and view the complete annual report
Please find page 46 of the 2013 Cisco annual report below. You can navigate through the pages in the report by either clicking on the pages listed below, or by using the keyword search tool below to find specific information within the annual report.-
 1
1 -
2
-
3
-
4
-
5
-
6
-
7
-
8
-
9
-
10
-
11
-
12
-
13
-
14
-
15
-
16
-
17
-
18
-
19
-
20
-
21
-
22
-
23
-
24
-
25
-
26
-
27
-
28
-
29
-
30
-
31
-
32
-
33
-
34
-
35
-
 36
36 -
 37
37 -
 38
38 -
 39
39 -
 40
40 -
 41
41 -
 42
42 -
 43
43 -
 44
44 -
 45
45 -
 46
46 -
 47
47 -
 48
48 -
 49
49 -
 50
50 -
 51
51 -
 52
52 -
 53
53 -
 54
54 -
 55
55 -
 56
56 -
57
-
58
-
59
-
60
-
61
-
62
-
63
-
64
-
65
-
66
-
67
-
68
-
69
-
70
-
71
-
72
-
73
-
74
-
75
-
76
-
77
-
78
-
79
-
80
-
81
-
82
-
83
-
84
-
85
-
86
-
87
-
88
-
89
-
90
-
91
-
92
-
93
-
94
-
95
-
96
-
97
-
98
-
99
-
100
-
101
-
102
-
103
-
104
-
105
-
106
-
107
-
108
-
109
-
110
-
111
-
112
-
113
-
114
-
115
-
116
-
117
-
118
-
119
-
120
-
121
-
122
-
123
-
124
-
125
-
126
-
127
-
128
-
129
-
130
-
131
-
132
-
133
-
134
-
135
-
136
-
137
-
138
-
139
-
140
 |
 |
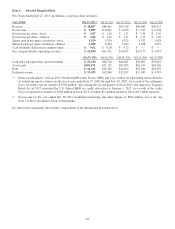
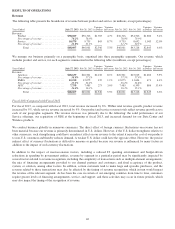
Fiscal 2013 Compared with Fiscal 2012—Financial Performance
Revenue increased 6%, with product revenue increasing 5% and service revenue increasing 9%. Total gross margin decreased
by 0.6 percentage points. Various items such as higher amortization of purchased intangible assets and the TiVo patent
litigation settlement in the fourth quarter of fiscal 2013 contributed to the product gross margin percentage decline. As a
percentage of revenue, research and development, sales and marketing, and general and administrative expenses collectively
declined by 1.4 percentage points, primarily due to lower sales and marketing expenses and lower general and administrative
expenses. General and administrative expenses were lower due primarily to the absence in the current fiscal year of
impairment charges on real estate held for sale. Operating income as a percentage of revenue increased by 1.1 percentage
points, primarily as a result of an increase in revenue, lower restructuring charges, and our continuing focus on expense
management. Diluted earnings per share increased by 25% from the prior year, a result of both a 24% increase in net income
and also, to a lesser degree, from a slight decline of 24 million shares in our diluted share count. A significant driver of the
increase in net income in fiscal 2013 was our realization of additional tax benefits of $1.0 billion, primarily related to a tax
settlement with the IRS and the reinstatement of the U.S. federal R&D tax credit.
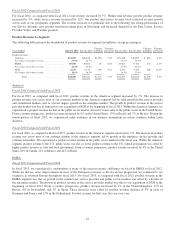
Fiscal 2013 Compared with Fiscal 2012—Business Summary
Our solid fiscal 2013 performance reflects our continued execution on our financial strategy to deliver profitable growth to
maximize shareholder value for the long term. In what continues to be a challenging and inconsistent global macroeconomic
environment, we grew profits faster than revenue, with revenue increasing by 6%, while net income increased by 24%.
In fiscal 2013, revenue increased by $2.5 billion. The Americas contributed $2.1 billion of the increase, led by higher sales in
the United States. APJC contributed $0.3 billion to the revenue increase, led by strong sales growth in India. EMEA added
$0.1 billion to the revenue increase in fiscal 2013. Both our product and service categories experienced revenue growth across
each of our geographic segments. We encountered certain challenges from a geographic perspective, including those related to
macroeconomic challenges in much of Europe. We also faced some macroeconomic challenges in APJC, particularly in the
fourth quarter of fiscal 2013, which most notably involved China and Japan. Partially offsetting these challenges was solid
revenue growth in fiscal 2013 in certain emerging countries such as Mexico within the Americas, India within APJC, and
Russia within EMEA.
From a customer markets standpoint, in fiscal 2013 we had solid revenue growth in the commercial market, as well as growth
in the service provider market, due in large part to the acquisition of NDS. The enterprise and public sector customer markets
experienced slight declines in revenue in fiscal 2013 as compared with fiscal 2012. Global public sector spending was a
challenge for us in fiscal 2013, particularly in the Americas, attributable in part to lower U.S. public sector spending during
parts of fiscal 2013 as compared with fiscal 2012.
In fiscal 2013, product revenue increased by $1.7 billion, while service revenue increased by $0.8 billion. The product revenue
increase was driven by the following: an increase of $1.0 billion from Service Provider Video products, driven primarily by
the acquisition of NDS at the beginning of fiscal 2013; an increase of $0.8 billion from Data Center products, due to continued
strong customer demand; and an increase of $0.5 billion from Wireless products, due to continued demand for these solutions.
These product revenue increases, along with the service revenue contribution, reflect, in our view, the success we are
experiencing with our technology architectures and our ability to deliver customer solutions, particularly in both the enterprise
and service provider data center and cloud environments. Overall, our product revenue from our core product areas was flat as
an increase in revenue from our Switching products was offset by a decrease in revenue from our NGN Routing products.
We achieved solid and profitable growth in fiscal 2013, and did so in a challenging and inconsistent global macroeconomic
environment. This included, in particular, weakness in the European economy, lower global public sector spending, and a
conservative approach to IT-related capital spending by customers. Notwithstanding improvements we saw in some of these
areas during the latter part of fiscal 2013, our business in fiscal 2014 may continue to be impacted by these challenges, as well
as other macroeconomic challenges including weakness in certain emerging countries, such as China.
In order to invest more significantly in our growth opportunity areas of our portfolio including cloud, Data Center, mobility,
services, software and security, we will rebalance our resources in fiscal 2014. As a result, we have announced a workforce
reduction plan that will impact approximately 4,000 employees or 5% of our global workforce. We expect that these actions
will position Cisco to invest in these growth opportunities as our business continues to evolve and to drive operational
efficiencies.
38