Cisco 2013 Annual Report Download - page 100
Download and view the complete annual report
Please find page 100 of the 2013 Cisco annual report below. You can navigate through the pages in the report by either clicking on the pages listed below, or by using the keyword search tool below to find specific information within the annual report.-
 1
1 -
2
-
3
-
4
-
5
-
6
-
7
-
8
-
9
-
10
-
11
-
12
-
13
-
14
-
15
-
16
-
17
-
18
-
19
-
20
-
21
-
22
-
23
-
24
-
25
-
26
-
27
-
28
-
29
-
30
-
31
-
32
-
33
-
34
-
35
-
36
-
37
-
38
-
39
-
40
-
41
-
42
-
43
-
44
-
45
-
46
-
47
-
48
-
49
-
50
-
51
-
52
-
53
-
54
-
55
-
56
-
57
-
58
-
59
-
60
-
61
-
62
-
63
-
64
-
65
-
66
-
67
-
68
-
69
-
70
-
71
-
72
-
73
-
74
-
75
-
76
-
77
-
78
-
79
-
80
-
81
-
82
-
83
-
84
-
85
-
86
-
87
-
88
-
89
-
 90
90 -
 91
91 -
 92
92 -
 93
93 -
 94
94 -
 95
95 -
 96
96 -
 97
97 -
 98
98 -
 99
99 -
 100
100 -
 101
101 -
 102
102 -
 103
103 -
 104
104 -
 105
105 -
 106
106 -
 107
107 -
 108
108 -
 109
109 -
 110
110 -
111
-
112
-
113
-
114
-
115
-
116
-
117
-
118
-
119
-
120
-
121
-
122
-
123
-
124
-
125
-
126
-
127
-
128
-
129
-
130
-
131
-
132
-
133
-
134
-
135
-
136
-
137
-
138
-
139
-
140
 |
 |

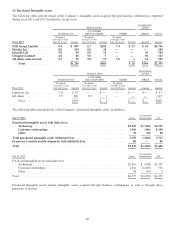
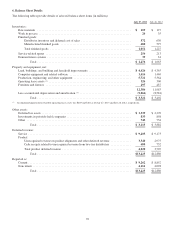
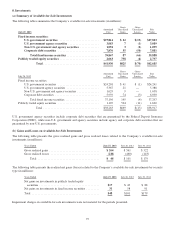
6. Balance Sheet Details
The following tables provide details of selected balance sheet items (in millions):
July 27, 2013 July 28, 2012
Inventories:
Raw materials ................................................................ $ 105 $ 127
Work in process ............................................................... 24 35
Finished goods:
Distributor inventory and deferred cost of sales .................................. 572 630
Manufactured finished goods ................................................ 480 597
Total finished goods ....................................................... 1,052 1,227
Service-related spares .......................................................... 256 213
Demonstration systems ......................................................... 39 61
Total ................................................................ $ 1,476 $ 1,663
Property and equipment, net:
Land, buildings, and building and leasehold improvements ............................. $ 4,426 $ 4,363
Computer equipment and related software .......................................... 1,416 1,469
Production, engineering, and other equipment ....................................... 5,721 5,364
Operating lease assets (1) ........................................................ 326 300
Furniture and fixtures .......................................................... 497 487
12,386 11,983
Less accumulated depreciation and amortization (1) ................................... (9,064) (8,581)
Total ................................................................ $ 3,322 $ 3,402
(1) Accumulated depreciation related to operating lease assets was $203 and $181 as of July 27, 2013 and July 28, 2012, respectively.
Other assets:
Deferred tax assets ............................................................. $ 1,539 $ 2,270
Investments in privately held companies ............................................ 833 858
Other ....................................................................... 743 754
Total ................................................................ $ 3,115 $ 3,882
Deferred revenue:
Service ...................................................................... $ 9,403 $ 9,173
Product:
Unrecognized revenue on product shipments and other deferred revenue .............. 3,340 2,975
Cash receipts related to unrecognized revenue from two-tier distributors .............. 680 732
Total product deferred revenue ............................................... 4,020 3,707
Total ................................................................ $13,423 $12,880
Reported as:
Current ...................................................................... $ 9,262 $ 8,852
Noncurrent ................................................................... 4,161 4,028
Total ................................................................ $13,423 $12,880
92