Cisco 2013 Annual Report Download - page 57
Download and view the complete annual report
Please find page 57 of the 2013 Cisco annual report below. You can navigate through the pages in the report by either clicking on the pages listed below, or by using the keyword search tool below to find specific information within the annual report.-
 1
1 -
2
-
3
-
4
-
5
-
6
-
7
-
8
-
9
-
10
-
11
-
12
-
13
-
14
-
15
-
16
-
17
-
18
-
19
-
20
-
21
-
22
-
23
-
24
-
25
-
26
-
27
-
28
-
29
-
30
-
31
-
32
-
33
-
34
-
35
-
36
-
37
-
38
-
39
-
40
-
41
-
42
-
43
-
44
-
45
-
46
-
 47
47 -
 48
48 -
 49
49 -
 50
50 -
 51
51 -
 52
52 -
 53
53 -
 54
54 -
 55
55 -
 56
56 -
 57
57 -
 58
58 -
 59
59 -
 60
60 -
 61
61 -
 62
62 -
 63
63 -
 64
64 -
 65
65 -
 66
66 -
 67
67 -
68
-
69
-
70
-
71
-
72
-
73
-
74
-
75
-
76
-
77
-
78
-
79
-
80
-
81
-
82
-
83
-
84
-
85
-
86
-
87
-
88
-
89
-
90
-
91
-
92
-
93
-
94
-
95
-
96
-
97
-
98
-
99
-
100
-
101
-
102
-
103
-
104
-
105
-
106
-
107
-
108
-
109
-
110
-
111
-
112
-
113
-
114
-
115
-
116
-
117
-
118
-
119
-
120
-
121
-
122
-
123
-
124
-
125
-
126
-
127
-
128
-
129
-
130
-
131
-
132
-
133
-
134
-
135
-
136
-
137
-
138
-
139
-
140
 |
 |

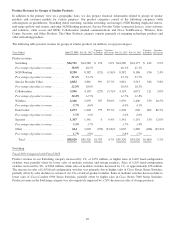
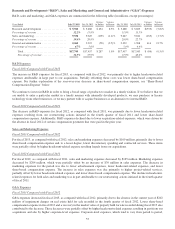
Product Revenue by Groups of Similar Products
In addition to the primary view on a geographic basis, we also prepare financial information related to groups of similar
products and customer markets for various purposes. Our product categories consist of the following categories (with
subcategories in parentheses): Switching (fixed switching, modular switching, and storage); NGN Routing (high-end routers,
mid-range and low-end routers, and other NGN Routing products); Service Provider Video (connected devices, video software
and solutions, cable access and NDS); Collaboration (unified communications and Cisco TelePresence); Wireless; Data
Center; Security; and Other Products. The Other Products category consists primarily of emerging technology products and
other networking products.
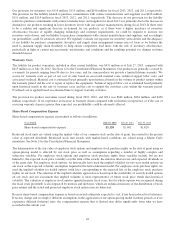
The following table presents revenue for groups of similar products (in millions, except percentages):
Years Ended July 27, 2013 July 28, 2012
Variance
in Dollars
Variance
in Percent July 28, 2012 July 30, 2011
Variance
in Dollars
Variance
in Percent
Product revenue:
Switching ......................... $14,741 $14,589 $ 152 1.0% $14,589 $14,177 $ 412 2.9%
Percentage of product revenue ........ 38.8% 40.1% 40.1% 41.1%
NGN Routing ..................... 8,230 8,382 (152) (1.8)% 8,382 8,186 196 2.4%
Percentage of product revenue ........ 21.6% 23.1% 23.1% 23.7%
Service Provider Video .............. 4,852 3,861 991 25.7% 3,861 3,515 346 9.8%
Percentage of product revenue ........ 12.8% 10.6% 10.6% 10.2%
Collaboration ...................... 3,956 4,193 (237) (5.7)% 4,193 4,072 121 3.0%
Percentage of product revenue ........ 10.4% 11.5% 11.5% 11.8%
Wireless .......................... 2,166 1,659 507 30.6% 1,659 1,400 259 18.5%
Percentage of product revenue ........ 5.7% 4.6% 4.6% 4.1%
Data Center ....................... 2,073 1,298 775 59.7% 1,298 696 602 86.5%
Percentage of product revenue ........ 5.5% 3.6% 3.6% 2.0%
Security .......................... 1,347 1,341 6 0.4% 1,341 1,191 150 12.6%
Percentage of product revenue ........ 3.5% 3.7% 3.7% 3.4%
Other ............................ 664 1,003 (339) (33.8)% 1,003 1,289 (286) (22.2)%
Percentage of product revenue ........ 1.7% 2.8% 2.8% 3.7%
Total .......................... $38,029 $36,326 $1,703 4.7% $36,326 $34,526 $1,800 5.2%
Switching
Fiscal 2013 Compared with Fiscal 2012
Product revenue in our Switching category increased by 1%, or $152 million, as higher sales of LAN fixed-configuration
switches were partially offset by lower sales of modular switches and storage products. Sales of LAN fixed-configuration
switches increased by 4%, or $366 million, while sales of modular switches decreased by 1%, or approximately $76 million.
The increase in sales of LAN fixed-configuration switches was primarily due to higher sales of Cisco Nexus Series Switches,
partially offset by sales declines in certain of our Cisco Catalyst product families. Sales of modular switches decreased due to
lower sales of Cisco Catalyst 6500 Series Switches, partially offset by higher sales in Cisco Nexus 7000 Series Switches.
Product revenue in the Switching category was also negatively impacted by a 24% decrease in sales of storage products.
49