Cisco 2013 Annual Report Download - page 118
Download and view the complete annual report
Please find page 118 of the 2013 Cisco annual report below. You can navigate through the pages in the report by either clicking on the pages listed below, or by using the keyword search tool below to find specific information within the annual report.-
 1
1 -
2
-
3
-
4
-
5
-
6
-
7
-
8
-
9
-
10
-
11
-
12
-
13
-
14
-
15
-
16
-
17
-
18
-
19
-
20
-
21
-
22
-
23
-
24
-
25
-
26
-
27
-
28
-
29
-
30
-
31
-
32
-
33
-
34
-
35
-
36
-
37
-
38
-
39
-
40
-
41
-
42
-
43
-
44
-
45
-
46
-
47
-
48
-
49
-
50
-
51
-
52
-
53
-
54
-
55
-
56
-
57
-
58
-
59
-
60
-
61
-
62
-
63
-
64
-
65
-
66
-
67
-
68
-
69
-
70
-
71
-
72
-
73
-
74
-
75
-
76
-
77
-
78
-
79
-
80
-
81
-
82
-
83
-
84
-
85
-
86
-
87
-
88
-
89
-
90
-
91
-
92
-
93
-
94
-
95
-
96
-
97
-
98
-
99
-
100
-
101
-
102
-
103
-
104
-
105
-
106
-
107
-
 108
108 -
 109
109 -
 110
110 -
 111
111 -
 112
112 -
 113
113 -
 114
114 -
 115
115 -
 116
116 -
 117
117 -
 118
118 -
 119
119 -
 120
120 -
 121
121 -
 122
122 -
 123
123 -
 124
124 -
 125
125 -
 126
126 -
 127
127 -
 128
128 -
129
-
130
-
131
-
132
-
133
-
134
-
135
-
136
-
137
-
138
-
139
-
140
 |
 |

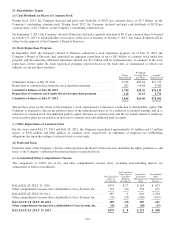
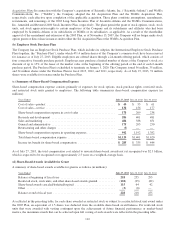
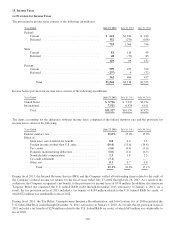
13. Shareholders’ Equity
(a) Cash Dividends on Shares of Common Stock
During fiscal 2013, the Company declared and paid cash dividends of $0.62 per common share, or $3.3 billion, on the
Company’s outstanding common stock. During fiscal 2012, the Company declared and paid cash dividends of $0.28 per
common share, or $1.5 billion, on the Company’s outstanding common stock.
On September 3, 2013, the Company’s Board of Directors declared a quarterly dividend of $0.17 per common share to be paid
on October 23, 2013 to all shareholders of record as of the close of business on October 3, 2013. Any future dividends will be
subject to the approval of the Company’s Board of Directors.
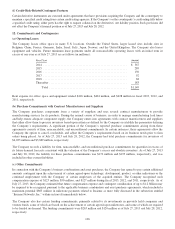
(b) Stock Repurchase Program
In September 2001, the Company’s Board of Directors authorized a stock repurchase program. As of July 27, 2013, the
Company’s Board of Directors had authorized an aggregate repurchase of up to $82 billion of common stock under this
program, and the remaining authorized repurchase amount was $3.1 billion with no termination date. A summary of the stock
repurchase activity under the stock repurchase program, reported based on the trade date, is summarized as follows (in
millions, except per-share amounts):
Shares
Repurchased
Weighted-
Average Price
per Share
Amount
Repurchased
Cumulative balance at July 30, 2011 ......................................... 3,478 $20.64 $71,773
Repurchase of common stock under the stock repurchase program ................. 262 16.64 4,360
Cumulative balance at July 28, 2012 ....................................... 3,740 $20.36 $76,133
Repurchase of common stock under the stock repurchase program ............. 128 21.63 2,773
Cumulative balance at July 27, 2013 ....................................... 3,868 $20.40 $78,906
The purchase price for the shares of the Company’s stock repurchased is reflected as a reduction to shareholders’ equity. The
Company is required to allocate the purchase price of the repurchased shares as (i) a reduction to retained earnings and (ii) a
reduction of common stock and additional paid-in capital. Issuance of common stock and the tax benefit related to employee
stock incentive plans are recorded as an increase to common stock and additional paid-in capital.
(c) Other Repurchases of Common Stock
For the years ended July 27, 2013 and July 28, 2012, the Company repurchased approximately 16 million and 12 million
shares, or $330 million and $200 million, of common stock, respectively, in settlement of employee tax withholding
obligations due upon the vesting of restricted stock or stock units.
(d) Preferred Stock
Under the terms of the Company’s Articles of Incorporation, the Board of Directors may determine the rights, preferences, and
terms of the Company’s authorized but unissued shares of preferred stock.
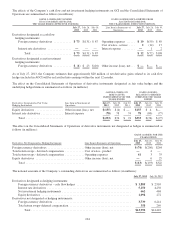
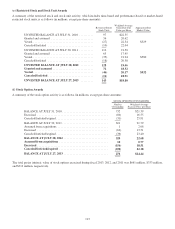
(e) Accumulated Other Comprehensive Income
The components of AOCI, net of tax, and other comprehensive income (loss), excluding noncontrolling interest, are
summarized as follows (in millions):
Net Unrealized
Gains on
Investments
Net Unrealized
Gains (Losses)
Cash Flow
Hedging
Instruments
Cumulative
Translation
Adjustment and
Other
Accumulated
Other
Comprehensive
Income
BALANCE AT JULY 31, 2010 .................................... $333 $ 27 $ 263 $ 623
Other comprehensive income (loss) attributable to Cisco Systems, Inc. .... 154 (21) 538 671
BALANCE AT JULY 30, 2011 .................................... 487 6 801 1,294
Other comprehensive income (loss) attributable to Cisco Systems, Inc. .... (78) (59) (496) (633)
BALANCE AT JULY 28, 2012 ................................... 409 (53) 305 661
Other comprehensive income (loss) attributable to Cisco Systems, Inc. .... (30) 61 (84) (53)
BALANCE AT JULY 27, 2013 ................................... $379 $ 8 $ 221 $ 608
110