Cisco 2009 Annual Report Download - page 77
Download and view the complete annual report
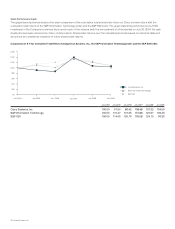
Please find page 77 of the 2009 Cisco annual report below. You can navigate through the pages in the report by either clicking on the pages listed below, or by using the keyword search tool below to find specific information within the annual report.-
 1
1 -
2
-
3
-
4
-
5
-
6
-
7
-
8
-
9
-
10
-
11
-
12
-
13
-
14
-
15
-
16
-
17
-
18
-
19
-
20
-
21
-
22
-
23
-
24
-
25
-
26
-
27
-
28
-
29
-
30
-
31
-
32
-
33
-
34
-
35
-
36
-
37
-
38
-
39
-
40
-
41
-
42
-
43
-
44
-
45
-
46
-
47
-
48
-
49
-
50
-
51
-
52
-
53
-
54
-
55
-
56
-
57
-
58
-
59
-
60
-
61
-
62
-
63
-
64
-
65
-
66
-
 67
67 -
 68
68 -
 69
69 -
 70
70 -
 71
71 -
 72
72 -
 73
73 -
 74
74 -
 75
75 -
 76
76 -
 77
77 -
 78
78 -
 79
79 -
 80
80 -
 81
81 -
 82
82 -
 83
83 -
 84
84
 |
 |

Notes to Consolidated Financial Statements
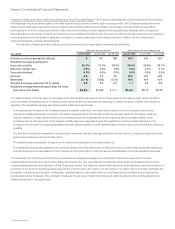
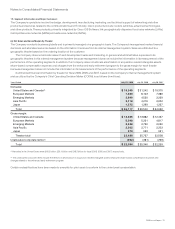
15. Segment Information and Major Customers
The Company’s operations involve the design, development, manufacturing, marketing, and technical support of networking and other
products and services related to the communications and IT industry. Cisco products include routers, switches, advanced technologies,
and other products. These products, primarily integrated by Cisco IOS Software, link geographically dispersed local-area networks (LANs),
metropolitan-area networks (MANs) and wide-area networks (WANs).
(a) Net Sales and Gross Margin by Theater
The Company conducts business globally and is primarily managed on a geographic basis. The Company’s management makes financial
decisions and allocates resources based on the information it receives from its internal management system. Sales are attributed to a
geographic theater based on the ordering location of the customer.
The Company does not allocate research and development, sales and marketing, or general and administrative expenses to its
geographic theaters in this internal management system because management does not include the information in its measurement of the
performance of the operating segments. In addition, the Company does not allocate amortization of acquisition-related intangible assets,
share-based compensation expense, and charges from the enhanced early retirement program to the gross margin for each theater
because management does not include this information in its measurement of the performance of the operating segments.
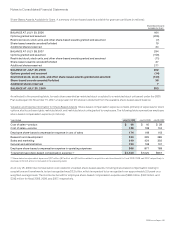
Summarized financial information by theater for fiscal 2009, 2008, and 2007, based on the Company’s internal management system
and as utilized by the Company’s Chief Operating Decision Maker (CODM), is as follows (in millions):
Years Ended July 25, 2009 July 26, 2008 July 28, 2007
Net sales:
United States and Canada(1) $ 19,345 $ 21,242 $ 19,315
European Markets 7,683 8,123 7,389
Emerging Markets 3,999 4,530 3,239
Asia Pacific 3,718 4,276 3,652
Japan 1,372 1,369 1,327
Total $ 36,117 $ 39,540 $ 34,922
Gross margin:
United States and Canada $ 12,685 $ 13,882 $ 12,437
European Markets 5,098 5,321 4,817
Emerging Markets 2,428 2,790 2,030
Asia Pacific 2,302 2,771 2,353
Japan 973 963 921
Theater total 23,486 25,727 22,558
Unallocated corporate items(2) (392) (381) (299)
Total $ 23,094 $ 25,346 $ 22,259
(1) Net sales in the United States were $18.2 billion, $20.1 billion, and $18.3 billion for fiscal 2009, 2008, and 2007, respectively.
(2) The unallocated corporate items include the effects of amortization of acquisition-related intangible assets, employee share-based compensation expense, and
charges related to the enhanced early retirement program.
Certain reclassifications have been made to amounts for prior years to conform to the current year’s presentation.
2009 Annual Report 75