Cisco 2009 Annual Report Download - page 19
Download and view the complete annual report
Please find page 19 of the 2009 Cisco annual report below. You can navigate through the pages in the report by either clicking on the pages listed below, or by using the keyword search tool below to find specific information within the annual report.-
 1
1 -
2
-
3
-
4
-
5
-
6
-
7
-
8
-
 9
9 -
 10
10 -
 11
11 -
 12
12 -
 13
13 -
 14
14 -
 15
15 -
 16
16 -
 17
17 -
 18
18 -
 19
19 -
 20
20 -
 21
21 -
 22
22 -
 23
23 -
 24
24 -
 25
25 -
 26
26 -
 27
27 -
 28
28 -
 29
29 -
30
-
31
-
32
-
33
-
34
-
35
-
36
-
37
-
38
-
39
-
40
-
41
-
42
-
43
-
44
-
45
-
46
-
47
-
48
-
49
-
50
-
51
-
52
-
53
-
54
-
55
-
56
-
57
-
58
-
59
-
60
-
61
-
62
-
63
-
64
-
65
-
66
-
67
-
68
-
69
-
70
-
71
-
72
-
73
-
74
-
75
-
76
-
77
-
78
-
79
-
80
-
81
-
82
-
83
-
84
 |
 |

Management’s Discussion and Analysis of Financial Condition and Results of Operations
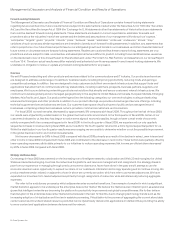
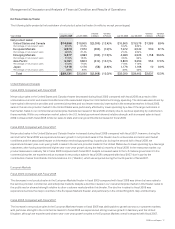
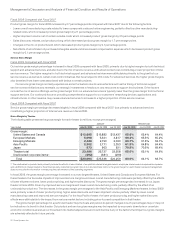
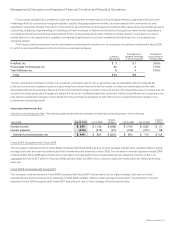
Net Product Sales by Theater
The following table presents the breakdown of net product sales by theater (in millions, except percentages):
Years Ended July 25, 2009 July 26, 2008
Variance
in Dollars
Variance
in Percent July 26, 2008 July 28, 2007
Variance
in Dollars
Variance
in Percent
Net product sales:
United States and Canada $14,866 $16,965 $(2,099) (12.4)% $16,965 $15,579 $1,386 8.9%
Percentage of net product sales 51.0% 51.2% 51.2% 52.9%
European Markets 6,579 7,072 (493) (7.0)% 7,072 6,542 530 8.1%
Percentage of net product sales 22.6% 21.4% 21.4% 22.2%
Emerging Markets 3,377 4,083 (706) (17.3)% 4,083 2,925 1,158 39.6%
Percentage of net product sales 11.6% 12.3% 12.3% 9.9%
Asia Pacific 3,191 3,803 (612) (16.1)% 3,803 3,250 553 17.0%
Percentage of net product sales 11.0% 11.5% 11.5% 11.0%
Japan 1,118 1,176 (58) (4.9)% 1,176 1,166 10 0.9%
Percentage of net product sales 3.8% 3.6% 3.6% 4.0%
Total $29,131 $33,099 $(3,968) (12.0)% $33,099 $29,462 $3,637 12.3%
United States and Canada
Fiscal 2009 Compared with Fiscal 2008
Net product sales in the United States and Canada theater decreased during fiscal 2009 compared with fiscal 2008 as a result of the
unfavorable economic and market conditions and the associated impact on information technology spending. The decrease was driven by
lower sales in the service provider and commercial markets and to a lesser extent by lower sales in the enterprise market. In fiscal 2009,
sales in the service provider market in the United States were particularly affected by lower spending by a few of the large customers in
that market. Sales in our commercial and enterprise markets decreased in fiscal 2009, primarily due to cautious spending by customers in
these markets. Within our enterprise market, sales to the U.S. federal government showed relative strength, with increased sales in fiscal
2009 compared with fiscal 2008, while our sales to state and local governments decreased in fiscal 2009.
Fiscal 2008 Compared with Fiscal 2007
Net product sales in the United States and Canada theater increased during fiscal 2008 compared with fiscal 2007; however, during the
second half of fiscal 2008, we experienced slower growth in net product sales in this theater due to unfavorable economic and market
conditions and the associated impact on information technology spending. In particular, during the second half of fiscal 2008, we
experienced slower year-over-year growth in sales in the service provider market in the United States due to lower spending by a few large
customers, after having experienced higher year-over-year growth during the first six months of fiscal 2008. In the enterprise market, our
product sales were relatively flat in fiscal 2008 compared with fiscal 2007 despite increased sales to the U.S. federal government. In the
commercial market, we experienced an increase in net product sales in fiscal 2008 compared with fiscal 2007, due in part to the
contribution of sales from WebEx Communications, Inc. (“WebEx”), which we acquired during the fourth quarter of fiscal 2007.
European Markets
Fiscal 2009 Compared with Fiscal 2008
The decrease in net product sales in the European Markets theater in fiscal 2009 compared with fiscal 2008 was driven by lower sales to
the service provider, commercial, and enterprise markets. Despite a decline in sales in our overall enterprise market in this theater, sales to
the public sector showed strength relative to other customer markets within this theater. The decline in sales for fiscal 2009 was
experienced across the major countries in the European Markets theater, and particularly in the United Kingdom, Italy, and Germany.
Fiscal 2008 Compared with Fiscal 2007
The increase in net product sales in the European Markets theater in fiscal 2008 was attributable to growth across our customer markets,
with particular strength in the commercial market. In fiscal 2008, we experienced strong revenue growth in Germany and the United
Kingdom, although we experienced slower year-over-year growth in sales in the European Markets overall compared with fiscal 2007.
2009 Annual Report 17