Cisco 2009 Annual Report Download - page 27
Download and view the complete annual report
Please find page 27 of the 2009 Cisco annual report below. You can navigate through the pages in the report by either clicking on the pages listed below, or by using the keyword search tool below to find specific information within the annual report.-
 1
1 -
2
-
3
-
4
-
5
-
6
-
7
-
8
-
9
-
10
-
11
-
12
-
13
-
14
-
15
-
16
-
 17
17 -
 18
18 -
 19
19 -
 20
20 -
 21
21 -
 22
22 -
 23
23 -
 24
24 -
 25
25 -
 26
26 -
 27
27 -
 28
28 -
 29
29 -
 30
30 -
 31
31 -
 32
32 -
 33
33 -
 34
34 -
 35
35 -
 36
36 -
 37
37 -
38
-
39
-
40
-
41
-
42
-
43
-
44
-
45
-
46
-
47
-
48
-
49
-
50
-
51
-
52
-
53
-
54
-
55
-
56
-
57
-
58
-
59
-
60
-
61
-
62
-
63
-
64
-
65
-
66
-
67
-
68
-
69
-
70
-
71
-
72
-
73
-
74
-
75
-
76
-
77
-
78
-
79
-
80
-
81
-
82
-
83
-
84
 |
 |

Management’s Discussion and Analysis of Financial Condition and Results of Operations
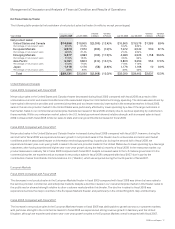
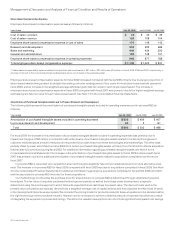
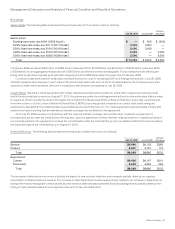
Sales and Marketing Expenses
Fiscal 2009 Compared with Fiscal 2008
Sales and marketing expenses declined in fiscal 2009 compared with fiscal 2008 due to a decrease of approximately $170 million in sales
expenses and a decrease of approximately $120 million in marketing expenses. The decrease in sales and marketing expenses was
primarily a result of lower discretionary expenses related to travel, meeting and events, marketing programs and outside services. An
additional factor that contributed to the decrease in sales and marketing expenses in fiscal 2009 was lower variable compensation
expenses, partially offset by the enhanced early retirement and limited workforce reduction charges. Foreign currency fluctuations, net of
hedging, decreased total sales and marketing expenses by approximately $200 million during fiscal 2009 compared with fiscal 2008.
Fiscal 2008 Compared with Fiscal 2007
Sales and marketing expenses increased in fiscal 2008 primarily due to an increase in sales expenses of approximately $1.0 billion. The
increase in sales expenses was primarily driven by headcount-related expenses, which included additional sales expenses related to
WebEx, which we acquired in the fourth quarter of fiscal 2007. Foreign currency fluctuations, net of hedging, increased total sales and
marketing expenses by approximately $250 million during fiscal 2008 compared with fiscal 2007.
G&A Expenses
Fiscal 2009 Compared with Fiscal 2008
The increase in G&A expenses in fiscal 2009 compared with fiscal 2008 was primarily due to increased project-related expenses, including
information- technology expenditures. Other factors also contributed to the increase in G&A expenses in fiscal 2009, including higher
share-based compensation and acquisition-related compensation expenses, as well as the enhanced early retirement and limited
workforce reduction charges in fiscal 2009.
Fiscal 2008 Compared with Fiscal 2007
G&A expenses for fiscal 2008 increased primarily due to increased headcount-related expenses and increased information technology-
related spending.
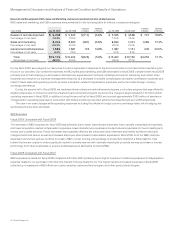
Effect of Foreign Currency
In fiscal 2009, foreign currency fluctuations, net of hedging, decreased combined R&D, sales and marketing, and G&A expenses by
approximately $280 million, or 1.8%, compared with fiscal 2008. In fiscal 2008, foreign currency fluctuations, net of hedging, increased
combined R&D, sales and marketing, and G&A expenses by approximately $332 million, or 2.5%, compared with fiscal 2007.
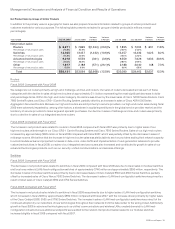
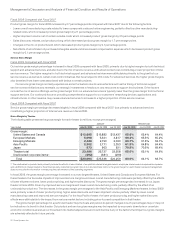
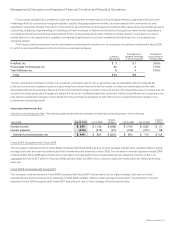
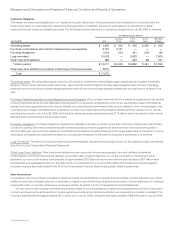
Headcount
Fiscal 2009 Compared with Fiscal 2008
Our headcount decreased by 584 employees in fiscal 2009. The decrease in headcount in fiscal 2009 resulted from our limited workforce
reduction actions, employee attrition, and a hiring pause. The decrease was partially offset by the effect of acquisitions and the hiring of
recent college graduates. We expect our headcount will continue to decrease in the near term when the effects of the limited workforce
reductions and the enhanced early retirement program are fully reflected.
Fiscal 2008 Compared with Fiscal 2007
In fiscal 2008, our headcount increased by 4,594 employees, reflecting the effects of our investments in sales and R&D as well as increased
investments in our service business and acquisitions.
2009 Annual Report 25