Cisco 2009 Annual Report Download - page 38
Download and view the complete annual report
Please find page 38 of the 2009 Cisco annual report below. You can navigate through the pages in the report by either clicking on the pages listed below, or by using the keyword search tool below to find specific information within the annual report.-
 1
1 -
2
-
3
-
4
-
5
-
6
-
7
-
8
-
9
-
10
-
11
-
12
-
13
-
14
-
15
-
16
-
17
-
18
-
19
-
20
-
21
-
22
-
23
-
24
-
25
-
26
-
27
-
 28
28 -
 29
29 -
 30
30 -
 31
31 -
 32
32 -
 33
33 -
 34
34 -
 35
35 -
 36
36 -
 37
37 -
 38
38 -
 39
39 -
 40
40 -
 41
41 -
 42
42 -
 43
43 -
 44
44 -
 45
45 -
 46
46 -
 47
47 -
 48
48 -
49
-
50
-
51
-
52
-
53
-
54
-
55
-
56
-
57
-
58
-
59
-
60
-
61
-
62
-
63
-
64
-
65
-
66
-
67
-
68
-
69
-
70
-
71
-
72
-
73
-
74
-
75
-
76
-
77
-
78
-
79
-
80
-
81
-
82
-
83
-
84
 |
 |

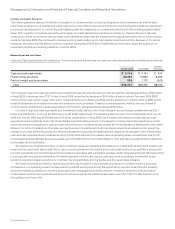
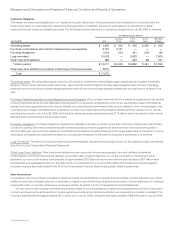
Quantitative and Qualitative Disclosures About Market Risk
Our financial position is exposed to a variety of risks including interest rate risk, equity price risk, and foreign currency exchange risk.
Interest Rate Risk
Fixed Income Investments
We maintain an investment portfolio of various holdings, types, and maturities. Our primary objective for holding fixed income securities is
to achieve an appropriate investment return consistent with preserving principal and managing risk. At any time, a sharp rise in interest
rates or credit spreads could have a material adverse impact on the fair value of our fixed income investment portfolio. Conversely,
declines in interest rates, including the impact from lower credit spreads, could have a material adverse impact on interest income for our
investment portfolio. We may utilize derivative instruments designated as hedging instruments to achieve our investment objectives. We
had no outstanding hedging instruments for our fixed income securities as of July 25, 2009. Our fixed income instruments are held for
purposes other than trading. Our fixed income instruments are not leveraged as of July 25, 2009. See Note 7 to the Consolidated Financial
Statements. We monitor our interest rate and credit risks, including our credit exposures to specific rating categories and to individual
issuers. We believe the overall credit quality of our portfolio is strong, with our cash equivalents and fixed income portfolio invested in
securities with a weighted-average credit rating exceeding AA.
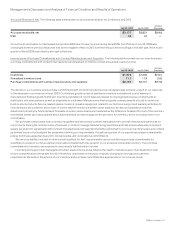
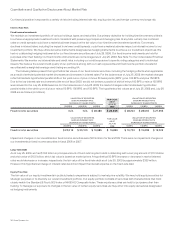
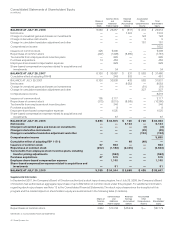
The following tables present the hypothetical fair values of our fixed income securities, including the hedging effects when applicable,
as a result of selected potential market decreases and increases in interest rates. For the balances as of July 25, 2009, the market changes
reflect immediate hypothetical parallel shifts in the yield curve of plus or minus 50 basis points (“BPS”), plus 100 BPS, and plus 150 BPS.
Due to the low interest rate environment at the end of fiscal 2009, we did not believe a parallel of shift of minus 100 BPS or minus 150 BPS
was relevant for the July 25, 2009 balances. For the balances as of July 26, 2008, the market changes reflect immediate hypothetical
parallel shifts in the yield curve of plus or minus 50 BPS, 100 BPS, and 150 BPS. The hypothetical fair values as of July 25, 2009 and July 26,
2008 are as follows (in millions):
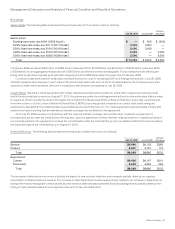
VALUATION OF SECURITIES
GIVEN AN INTEREST RATE
DECREASE OF X BASIS POINTS
FAIR VALUE
AS OF
JULY 25,
2009
VALUATION OF SECURITIES
GIVEN AN INTEREST RATE
INCREASE OF X BASIS POINTS
(150 BPS) (100 BPS) (50 BPS) 50 BPS 100 BPS 150 BPS
Fixed income securities N/A N/A $ 28,486 $ 28,355 $ 28,224 $ 28,093 $ 27,963
VALUATION OF SECURITIES
GIVEN AN INTEREST RATE
DECREASE OF X BASIS POINTS
FAIR VALUE
AS OF
JULY 26,
2008
VALUATION OF SECURITIES
GIVEN AN INTEREST RATE
INCREASE OF X BASIS POINTS
(150 BPS) (100 BPS) (50 BPS) 50 BPS 100 BPS 150 BPS
Fixed income securities $ 20,216 $ 20,100 $ 19,985 $ 19,869 $ 19,753 $ 19,638 $ 19,522
Impairment charges on our investments in fixed income securities were $219 million for fiscal 2009. There were no impairment charges on
our investments in fixed income securities in fiscal 2008 or 2007.
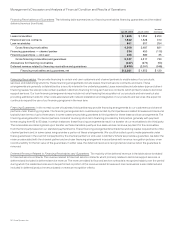
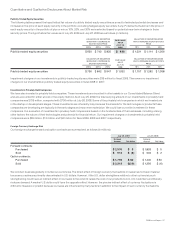
Long-Term Debt
As of July 25, 2009, we had $10.0 billion in principal amount of fixed-rate long-term debt outstanding, with a carrying amount of $10.3 billion
and a fair value of $10.5 billion, which fair value is based on market prices. A hypothetical 50 BPS increase or decrease in market interest
rates would decrease or increase, respectively, the fair value of the fixed-rate debt as of July 25, 2009 by approximately $300 million.
However, this hypothetical change in interest rates would not impact the interest expense on the fixed-rate debt.
Equity Price Risk
The fair value of our equity investments in publicly traded companies is subject to market price volatility. We may hold equity securities for
strategic purposes or to diversify our overall investment portfolio. Our equity portfolio consists of securities with characteristics that most
closely match the Standard & Poor’s 500 Index or NASDAQ Composite Index. These equity securities are held for purposes other than
trading. To manage our exposure to changes in the fair value of certain equity securities, we may enter into equity derivatives designated
as hedging instruments.
36 Cisco Systems, Inc.