Cisco 2009 Annual Report Download - page 30
Download and view the complete annual report
Please find page 30 of the 2009 Cisco annual report below. You can navigate through the pages in the report by either clicking on the pages listed below, or by using the keyword search tool below to find specific information within the annual report.-
 1
1 -
2
-
3
-
4
-
5
-
6
-
7
-
8
-
9
-
10
-
11
-
12
-
13
-
14
-
15
-
16
-
17
-
18
-
19
-
 20
20 -
 21
21 -
 22
22 -
 23
23 -
 24
24 -
 25
25 -
 26
26 -
 27
27 -
 28
28 -
 29
29 -
 30
30 -
 31
31 -
 32
32 -
 33
33 -
 34
34 -
 35
35 -
 36
36 -
 37
37 -
 38
38 -
 39
39 -
 40
40 -
41
-
42
-
43
-
44
-
45
-
46
-
47
-
48
-
49
-
50
-
51
-
52
-
53
-
54
-
55
-
56
-
57
-
58
-
59
-
60
-
61
-
62
-
63
-
64
-
65
-
66
-
67
-
68
-
69
-
70
-
71
-
72
-
73
-
74
-
75
-
76
-
77
-
78
-
79
-
80
-
81
-
82
-
83
-
84
 |
 |

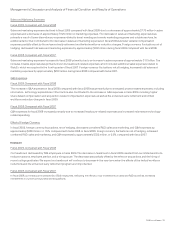
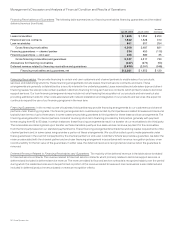
Management’s Discussion and Analysis of Financial Condition and Results of Operations
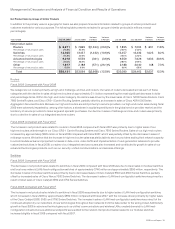
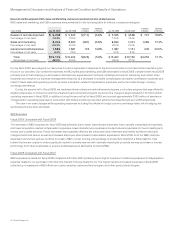
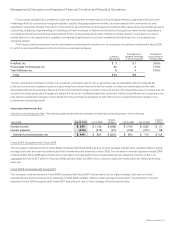
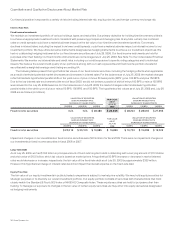
Other Income (Loss), Net The components of other income (loss), net, are as follows (in millions):
Years Ended July 25, 2009 July 26, 2008
Variance
in Dollars July 26, 2008 July 28, 2007
Variance
in Dollars
Net gains on investments in publicly traded equity
securities $86 $ 88 $ (2) $ 88 $ 268 $ (180)
Net (losses) gains on investments in fixed income
securities (110) 21 (131) 21 (18) 39
Total (24) 109 (133) 109 250 (141)
Net losses on investments in privately held
companies (56) (6) (50) (6) (40) 34
Other (48) (114) 66 (114) (85) (29)
Other income (loss), net $ (128) $ (11) $ (117) $ (11) $ 125 $ (136)
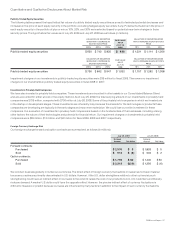
Fiscal 2009 Compared with Fiscal 2008
For fiscal 2009, we had an aggregate net loss on investments in publicly traded equity and fixed income securities recognized in other
income (loss), compared with a net gain in fiscal 2008. The net loss in fiscal 2009 was primarily a result of the volatile market conditions in
the fixed income market during parts of fiscal 2009, which resulted in impairment charges on fixed income securities of $219 million during
fiscal 2009. Net losses on fixed income securities in fiscal 2009 were partially offset by gains on investments in publicly traded equity
securities, which were primarily due to the termination of various forward sale agreements designated as fair value hedges of publicly
traded equity securities. Net gains on publicly traded equity securities include impairment charges of $39 million during fiscal 2009. See
Note 7 to the Consolidated Financial Statements for the unrealized gains and losses on investments.
Net losses on investments in privately held companies increased in fiscal 2009 compared with fiscal 2008 primarily as a result of
higher impairment charges, which were due to the deteriorating market conditions during parts of fiscal 2009. Net losses on investments in
privately held companies included impairment charges of $85 million in fiscal 2009 compared with $12 million in fiscal 2008.
Fiscal 2008 Compared with Fiscal 2007
In fiscal 2008, our total net gains on investments in publicly traded equity and fixed income securities recognized in other income (loss)
decreased compared with fiscal 2007 primarily as a result of market conditions. Net losses on investment in privately held companies
decreased in fiscal 2008 compared with fiscal 2007, in part as a result of lower impairment charges in fiscal 2008 of $12 million compared
with $22 million in fiscal 2007.
Other expenses in the preceding table of other income (loss), net, consisted primarily of foreign exchange activities and contributions
to charitable organizations.
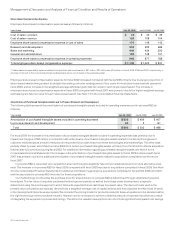
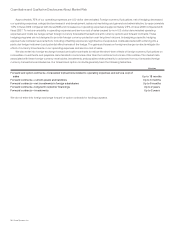
Provision for Income Taxes
Fiscal 2009 Compared with Fiscal 2008
The provision for income taxes resulted in an effective tax rate of 20.3% for fiscal 2009, compared with 21.5% for fiscal 2008. The net 1.2
percentage point decrease in the effective tax rates between fiscal years was attributable in part to a greater proportion of net income
which was subject to foreign income tax rates that are lower than the U.S. federal statutory rate of 35%. Additionally, the effective tax rate of
20.3% for fiscal 2009 included a tax benefit of $106 million, or 1.4 percentage points, related to fiscal 2008 R&D expenses due to the
retroactive reinstatement of the U.S. federal R&D tax credit, which was offset by tax costs of $174 million, or 2.3 percentage points, related
to a transfer pricing adjustment for share-based compensation. The transfer pricing adjustment, which occurred in the fourth quarter of
fiscal 2009, was a result of a decision by the U.S. Court of Appeals for the Ninth Circuit to overturn a 2005 U.S. Tax Court ruling in a case to
which we were not a party. The Ninth Circuit decision impacted the tax treatment of share-based compensation expenses for the purpose
of determining intangible development costs under a company’s R&D cost sharing arrangement. The effective tax rate of 21.5% for fiscal
2008 included a net tax benefit of $162 million, or 1.6 percentage points, from the settlement of certain tax matters with the IRS, offset by tax
costs of $226 million, or 2.2 percentage points, related to the intercompany realignment of certain of our foreign entities.
For a full reconciliation of our effective tax rate to the U.S. federal statutory rate of 35% and further explanation of our provision for
income taxes, see Note 14 to the Consolidated Financial Statements.
Fiscal 2008 Compared with Fiscal 2007
The provision for income taxes resulted in an effective tax rate of 21.5% for fiscal 2008, compared with 22.5% for fiscal 2007. The 1.0
percentage point decrease in the effective tax rate between fiscal years was primarily attributable to the net tax settlement of $162 million
discussed above and the tax impact of foreign operations, partially offset by the then expired U.S. federal R&D tax credit and the tax costs
related to the intercompany realignment of certain of our foreign entities.
28 Cisco Systems, Inc.