Cisco 2009 Annual Report Download - page 21
Download and view the complete annual report
Please find page 21 of the 2009 Cisco annual report below. You can navigate through the pages in the report by either clicking on the pages listed below, or by using the keyword search tool below to find specific information within the annual report.-
 1
1 -
2
-
3
-
4
-
5
-
6
-
7
-
8
-
9
-
10
-
 11
11 -
 12
12 -
 13
13 -
 14
14 -
 15
15 -
 16
16 -
 17
17 -
 18
18 -
 19
19 -
 20
20 -
 21
21 -
 22
22 -
 23
23 -
 24
24 -
 25
25 -
 26
26 -
 27
27 -
 28
28 -
 29
29 -
 30
30 -
 31
31 -
32
-
33
-
34
-
35
-
36
-
37
-
38
-
39
-
40
-
41
-
42
-
43
-
44
-
45
-
46
-
47
-
48
-
49
-
50
-
51
-
52
-
53
-
54
-
55
-
56
-
57
-
58
-
59
-
60
-
61
-
62
-
63
-
64
-
65
-
66
-
67
-
68
-
69
-
70
-
71
-
72
-
73
-
74
-
75
-
76
-
77
-
78
-
79
-
80
-
81
-
82
-
83
-
84
 |
 |

Management’s Discussion and Analysis of Financial Condition and Results of Operations
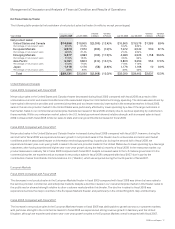
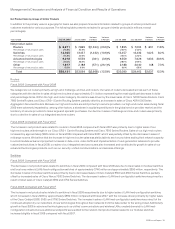
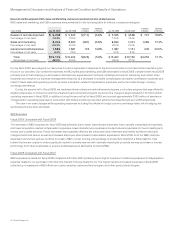
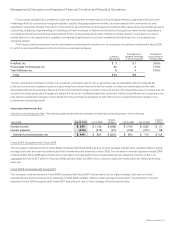
Net Product Sales by Groups of Similar Products
In addition to the primary view on a geographic basis, we also prepare financial information related to groups of similar products and
customer markets for various purposes. The following table presents net sales for groups of similar products (in millions, except
percentages):
Years Ended July 25, 2009 July 26, 2008
Variance
in Dollars
Variance
in Percent July 26, 2008 July 28, 2007
Variance
in Dollars
Variance
in Percent
Net product sales:
Routers $ 6,271 $ 7,895 $(1,624) (20.6)% $ 7,895 $ 7,064 $ 831 11.8%
Percentage of net product sales 21.5% 23.9% 23.9% 24.0%
Switches 12,025 13,457 (1,432) (10.6)% 13,457 12,432 1,025 8.2%
Percentage of net product sales 41.3% 40.6% 40.6% 42.2%
Advanced technologies 9,218 9,559 (341) (3.6)% 9,559 7,926 1,633 20.6%
Percentage of net product sales 31.6% 28.9% 28.9% 26.9%
Other 1,617 2,188 (571) (26.1)% 2,188 2,040 148 7.3%
Percentage of net product sales 5.6% 6.6% 6.6% 6.9%
Total $29,131 $33,099 $(3,968) (12.0)% $33,099 $29,462 $3,637 12.3%
Routers
Fiscal 2009 Compared with Fiscal 2008
We categorize our routers primarily as high-end, midrange, and low-end routers. Our sales of routers decreased across each of these
categories with the decline in sales of high-end routers of approximately $1.1 billion representing the most significant decrease in dollar
and percentage terms. Within the high-end router category, the decline was driven by the lower sales of Cisco 12000 Series Routers, Cisco
7600 Series Routers, and Cisco CRS-1 Carrier Routing System, partially offset by an increase in sales of Cisco ASR 1000 Series
Aggregation Services Routers. Because our high-end routers are sold primarily to service providers, our high-end router sales during fiscal
2009 were adversely impacted by, among other factors, a slowdown in capital expenditures in the global service provider market, and the
tendency of service providers to make large and sporadic purchases. Our decline in sales of midrange and low-end routers was primarily
due to a decline in sales of our integrated services routers.
Fiscal 2008 Compared with Fiscal 2007
The increase in net product sales related to routers in fiscal 2008 compared with fiscal 2007 was primarily due to higher sales of our
high-end routers, with strength in our Cisco CRS-1 Carrier Routing System and Cisco 7600 Series Routers. Sales of our high-end routers
increased by approximately $845 million in fiscal 2008 compared with fiscal 2007, which was partially offset by the decrease in sales of
midrange routers. We believe that the increase in high-end router sales was attributable to service providers scaling their network capacity
to accommodate actual and projected increases in data, voice, video traffic and implementation of next-generation networks to provide
customized solutions. In fiscal 2008, our sales of our integrated services routers also increased and contributed to growth in sales of our
advanced technologies products, such as our security, unified communications, and wireless offerings.
Switches
Fiscal 2009 Compared with Fiscal 2008
The decrease in net product sales related to switches in fiscal 2009 compared with fiscal 2008 was due to lower sales in modular switches
and local-area network (LAN) fixed-configuration switches of approximately $740 million and approximately $690 million, respectively. The
decrease in sales of modular switches was primarily due to decreased sales of Cisco Catalyst 6500 and 4500 Series Switches, partially
offset by increased sales of Cisco Nexus 7000 Series Switches. The decrease in sales of LAN fixed-configuration switches was primarily a
result of lower sales of Cisco Catalyst 3560 and 3750 Series Switches.
Fiscal 2008 Compared with Fiscal 2007
The increase in net product sales related to switches in fiscal 2008 was primarily due to higher sales of LAN fixed-configuration switches,
which increased in fiscal 2008 by approximately $860 million compared with fiscal 2007, with the increase driven primarily by higher sales
of the Cisco Catalyst 2960, 3560, and 3750 Series Switches. The increase in sales of LAN fixed-configuration switches was a result of the
continued adoption by our customers of new technologies throughout their networks from the data center to the wiring closet. Additionally,
growth in fiscal 2008 in advanced technologies, such as unified communications and wireless LANs, created demand for LAN fixed-
configuration infrastructure as additional endpoints were added to the network. Net product sales related to our modular switches
increased slightly in fiscal 2008 compared with fiscal 2007.
2009 Annual Report 19