Cisco 2009 Annual Report Download - page 71
Download and view the complete annual report
Please find page 71 of the 2009 Cisco annual report below. You can navigate through the pages in the report by either clicking on the pages listed below, or by using the keyword search tool below to find specific information within the annual report.-
 1
1 -
2
-
3
-
4
-
5
-
6
-
7
-
8
-
9
-
10
-
11
-
12
-
13
-
14
-
15
-
16
-
17
-
18
-
19
-
20
-
21
-
22
-
23
-
24
-
25
-
26
-
27
-
28
-
29
-
30
-
31
-
32
-
33
-
34
-
35
-
36
-
37
-
38
-
39
-
40
-
41
-
42
-
43
-
44
-
45
-
46
-
47
-
48
-
49
-
50
-
51
-
52
-
53
-
54
-
55
-
56
-
57
-
58
-
59
-
60
-
 61
61 -
 62
62 -
 63
63 -
 64
64 -
 65
65 -
 66
66 -
 67
67 -
 68
68 -
 69
69 -
 70
70 -
 71
71 -
 72
72 -
 73
73 -
 74
74 -
 75
75 -
 76
76 -
 77
77 -
 78
78 -
 79
79 -
 80
80 -
 81
81 -
82
-
83
-
84
 |
 |

Notes to Consolidated Financial Statements
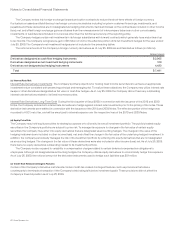
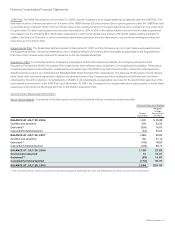
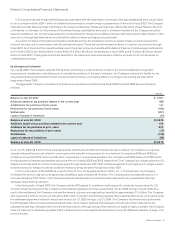
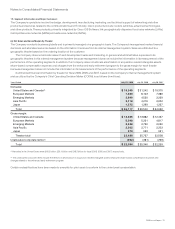
Share-Based Awards Available for Grant A summary of share-based awards available for grant are as follows (in millions):
Share-Based Awards
Available for Grant
BALANCE AT JULY 29, 2006 464
Options granted and assumed (206)
Restricted stock, stock units, and other share-based awards granted and assumed (7)
Share-based awards canceled/forfeited 19
Additional shares reserved 24
BALANCE AT JULY 28, 2007 294
Options granted and assumed (159)
Restricted stock, stock units, and other share-based awards granted and assumed (11)
Share-based awards canceled/forfeited 27
Additional shares reserved 211
BALANCE AT JULY 26, 2008 362
Options granted and assumed (14)
Restricted stock, stock units, and other share-based awards granted and assumed (140)
Share-based awards canceled/forfeited 38
Additional shares reserved 7
BALANCE AT JULY 25, 2009 253
As reflected in the preceding table, for each share awarded as restricted stock or subject to a restricted stock unit award under the 2005
Plan subsequent to November 15, 2007, an equivalent of 2.5 shares is deducted from the available share-based award balance.
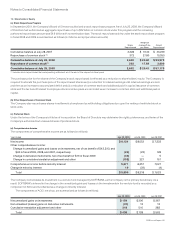
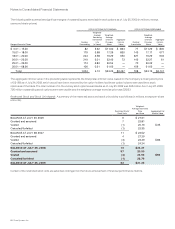
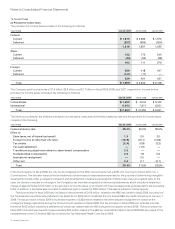
Valuation and Expense Information for Share-Based Awards Share-based compensation expense consists primarily of expenses for stock
options, stock purchase rights, restricted stock, and restricted stock units granted to employees. The following table summarizes employee
share-based compensation expense (in millions):
Years Ended July 25, 2009 July 26, 2008 July 28, 2007
Cost of sales—product $46 $40 $39
Cost of sales—service 128 108 104
Employee share-based compensation expense in cost of sales 174 148 143
Research and development 333 295 289
Sales and marketing 440 434 392
General and administrative 193 148 107
Employee share-based compensation expense in operating expenses 966 877 788
Total employee share-based compensation expense (1) $1,140 $1,025 $931
(1) Share-based compensation expense of $91 million, $87 million, and $34 million related to acquisitions and investments for fiscal 2009, 2008, and 2007, respectively, is
disclosed in Note 3 and is not included in the preceding table.
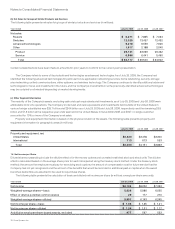
As of July 25, 2009, total compensation cost related to unvested share-based awards, including share-based compensation relating to
acquisitions and investments, not yet recognized was $3.2 billion, which is expected to be recognized over approximately 2.9 years on a
weighted-average basis. The income tax benefit for employee share-based compensation expense was $298 million, $330 million, and
$342 million for fiscal 2009, 2008, and 2007, respectively.
2009 Annual Report 69