Cisco 2009 Annual Report Download - page 18
Download and view the complete annual report
Please find page 18 of the 2009 Cisco annual report below. You can navigate through the pages in the report by either clicking on the pages listed below, or by using the keyword search tool below to find specific information within the annual report.-
 1
1 -
2
-
3
-
4
-
5
-
6
-
7
-
 8
8 -
 9
9 -
 10
10 -
 11
11 -
 12
12 -
 13
13 -
 14
14 -
 15
15 -
 16
16 -
 17
17 -
 18
18 -
 19
19 -
 20
20 -
 21
21 -
 22
22 -
 23
23 -
 24
24 -
 25
25 -
 26
26 -
 27
27 -
 28
28 -
29
-
30
-
31
-
32
-
33
-
34
-
35
-
36
-
37
-
38
-
39
-
40
-
41
-
42
-
43
-
44
-
45
-
46
-
47
-
48
-
49
-
50
-
51
-
52
-
53
-
54
-
55
-
56
-
57
-
58
-
59
-
60
-
61
-
62
-
63
-
64
-
65
-
66
-
67
-
68
-
69
-
70
-
71
-
72
-
73
-
74
-
75
-
76
-
77
-
78
-
79
-
80
-
81
-
82
-
83
-
84
 |
 |

Management’s Discussion and Analysis of Financial Condition and Results of Operations
Discussion of Fiscal 2009, 2008, and 2007
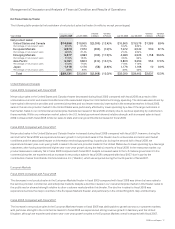
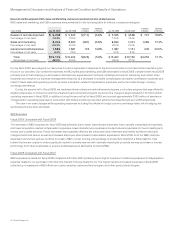
Net Sales
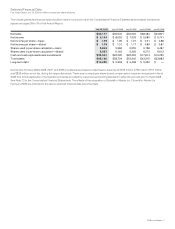
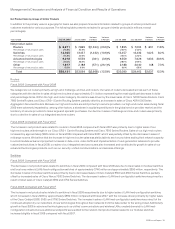
The following table presents the breakdown of net sales between product and service revenue (in millions, except percentages):
Years Ended July 25, 2009 July 26, 2008
Variance
in Dollars
Variance
in Percent July 26, 2008 July 28, 2007
Variance
in Dollars
Variance
in Percent
Net sales:
Product $29,131 $33,099 $(3,968) (12.0)% $33,099 $29,462 $3,637 12.3%
Percentage of net sales 80.7% 83.7% 83.7% 84.4%
Service 6,986 6,441 545 8.5% 6,441 5,460 981 18.0%
Percentage of net sales 19.3% 16.3% 16.3% 15.6%
Total $36,117 $39,540 $(3,423) (8.7)% $39,540 $34,922 $4,618 13.2%
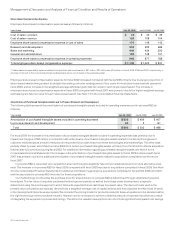
We primarily manage our business on a geographic basis, and we are organized into five geographic theaters. Our net sales, which include
product and service revenue, for each theater are summarized in the following table (in millions, except percentages):
Years Ended July 25, 2009 July 26, 2008
Variance
in Dollars
Variance
in Percent July 26, 2008 July 28, 2007
Variance
in Dollars
Variance
in Percent
Net sales:
United States and Canada $19,345 $21,242 $(1,897) (8.9)% $21,242 $19,315 $1,927 10.0%
Percentage of net sales 53.5% 53.7% 53.7% 55.2%
European Markets 7,683 8,123 (440) (5.4)% 8,123 7,389 734 9.9%
Percentage of net sales 21.3% 20.5% 20.5% 21.2%
Emerging Markets 3,999 4,530 (531) (11.7)% 4,530 3,239 1,291 39.9%
Percentage of net sales 11.1% 11.5% 11.5% 9.3%
Asia Pacific 3,718 4,276 (558) (13.0)% 4,276 3,652 624 17.1%
Percentage of net sales 10.3% 10.8% 10.8% 10.5%
Japan 1,372 1,369 3 0.2% 1,369 1,327 42 3.2%
Percentage of net sales 3.8% 3.5% 3.5% 3.8%
Total $36,117 $39,540 $(3,423) (8.7)% $39,540 $34,922 $4,618 13.2%
Fiscal 2009 Compared with Fiscal 2008
We experienced a decline in our net product sales in fiscal 2009 compared with fiscal 2008, while our service revenue showed a year-
over-year increase. The global economic downturn and the effect it has had on information technology spending resulted in year- over-
year decreases in product sales in our service provider, commercial, enterprise, and consumer markets and across all our geographic
theaters. However, within our enterprise market, the public sector showed relative strength across most of our geographic theaters,
compared with other customer markets within the respective theaters. Our net product sales may continue to be impacted by weakness in
the macroeconomic environment. Service revenue increased across all theaters, led by higher sales in the Emerging Markets theater.
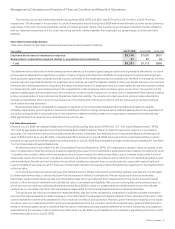
We conduct business globally in numerous currencies. The direct effect of foreign currency fluctuations on sales has not been
material because our sales are primarily denominated in U.S. dollars. However, if the U.S. dollar strengthens relative to other currencies,
such strengthening could have an indirect effect on our sales to the extent it raises the cost of our products to non-U.S. customers and
thereby reduces demand. A weaker U.S. dollar could have the opposite effect. However, the precise indirect effect of currency fluctuations
is difficult to measure or predict because our sales are influenced by many factors in addition to the impact of such currency fluctuations.
Net sales by theater in a particular period may be significantly impacted by several factors related to revenue recognition, including
large and sporadic purchases by customers particularly in our service provider market; the complexity of transactions such as multiple
element arrangements; the mix of financings provided to our channel partners and end-user customers; and final acceptance of the
product, system, or solution, among other factors.
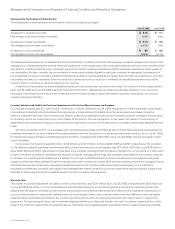
Fiscal 2008 Compared with Fiscal 2007
For fiscal 2008, total revenue increased in each of our geographic theaters and customer markets compared with fiscal 2007 as we
benefited from increased IT-related capital spending in our markets. Our sales also benefited from our entry into new markets and the
development of adjacent product offerings.
16 Cisco Systems, Inc.