Cisco 2009 Annual Report Download - page 43
Download and view the complete annual report
Please find page 43 of the 2009 Cisco annual report below. You can navigate through the pages in the report by either clicking on the pages listed below, or by using the keyword search tool below to find specific information within the annual report.-
 1
1 -
2
-
3
-
4
-
5
-
6
-
7
-
8
-
9
-
10
-
11
-
12
-
13
-
14
-
15
-
16
-
17
-
18
-
19
-
20
-
21
-
22
-
23
-
24
-
25
-
26
-
27
-
28
-
29
-
30
-
31
-
32
-
 33
33 -
 34
34 -
 35
35 -
 36
36 -
 37
37 -
 38
38 -
 39
39 -
 40
40 -
 41
41 -
 42
42 -
 43
43 -
 44
44 -
 45
45 -
 46
46 -
 47
47 -
 48
48 -
 49
49 -
 50
50 -
 51
51 -
 52
52 -
 53
53 -
54
-
55
-
56
-
57
-
58
-
59
-
60
-
61
-
62
-
63
-
64
-
65
-
66
-
67
-
68
-
69
-
70
-
71
-
72
-
73
-
74
-
75
-
76
-
77
-
78
-
79
-
80
-
81
-
82
-
83
-
84
 |
 |

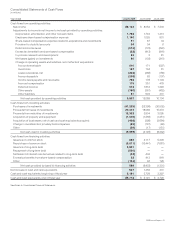
Consolidated Statements of Cash Flows
(in millions)
Years Ended July 25, 2009 July 26, 2008 July 28, 2007
Cash flows from operating activities:
Net income $6,134 $ 8,052 $ 7,333
Adjustments to reconcile net income to net cash provided by operating activities:
Depreciation, amortization, and other noncash items 1,768 1,744 1,413
Employee share-based compensation expense 1,140 1,025 931
Share-based compensation expense related to acquisitions and investments 91 87 34
Provision for doubtful accounts 54 34 6
Deferred income taxes (574) (772) (622)
Excess tax benefits from share-based compensation (22) (413) (918)
In-process research and development 63 381
Net losses (gains) on investments 80 (103) (210)
Change in operating assets and liabilities, net of effects of acquisitions:
Accounts receivable 610 171 (597)
Inventories 187 104 61
Lease receivables, net (222) (488) (156)
Accounts payable (208) 62 (107)
Income taxes payable and receivable 768 178 1,104
Accrued compensation 175 351 479
Deferred revenue 572 1,812 1,293
Other assets (780) (361) (452)
Other liabilities 61 603 431
Net cash provided by operating activities 9,897 12,089 10,104
Cash flows from investing activities:
Purchases of investments (41,225) (22,399) (20,532)
Proceeds from sales of investments 20,473 16,086 15,273
Proceeds from maturities of investments 12,352 3,904 2,095
Acquisition of property and equipment (1,005) (1,268) (1,251)
Acquisition of businesses, net of cash and cash equivalents acquired (426) (398) (3,684)
Change in investments in privately held companies (89) (101) (92)
Other (39) (17) (151)
Net cash used in investing activities (9,959) (4,193) (8,342)
Cash flows from financing activities:
Issuance of common stock 863 3,117 5,306
Repurchase of common stock (3,611) (10,441) (7,681)
Issuance of long-term debt 3,991 ——
Repayment of long-term debt (500) ——
Settlement of interest rate derivatives related to long-term debt (42) 432 —
Excess tax benefits from share-based compensation 22 413 918
Other (134) 46 126
Net cash provided by (used in) financing activities 589 (6,433) (1,331)
Net increase in cash and cash equivalents 527 1,463 431
Cash and cash equivalents, beginning of fiscal year 5,191 3,728 3,297
Cash and cash equivalents, end of fiscal year $5,718 $ 5,191 $ 3,728
See Notes to Consolidated Financial Statements.
2009 Annual Report 41