Cisco 2009 Annual Report Download - page 59
Download and view the complete annual report
Please find page 59 of the 2009 Cisco annual report below. You can navigate through the pages in the report by either clicking on the pages listed below, or by using the keyword search tool below to find specific information within the annual report.-
 1
1 -
2
-
3
-
4
-
5
-
6
-
7
-
8
-
9
-
10
-
11
-
12
-
13
-
14
-
15
-
16
-
17
-
18
-
19
-
20
-
21
-
22
-
23
-
24
-
25
-
26
-
27
-
28
-
29
-
30
-
31
-
32
-
33
-
34
-
35
-
36
-
37
-
38
-
39
-
40
-
41
-
42
-
43
-
44
-
45
-
46
-
47
-
48
-
 49
49 -
 50
50 -
 51
51 -
 52
52 -
 53
53 -
 54
54 -
 55
55 -
 56
56 -
 57
57 -
 58
58 -
 59
59 -
 60
60 -
 61
61 -
 62
62 -
 63
63 -
 64
64 -
 65
65 -
 66
66 -
 67
67 -
 68
68 -
 69
69 -
70
-
71
-
72
-
73
-
74
-
75
-
76
-
77
-
78
-
79
-
80
-
81
-
82
-
83
-
84
 |
 |
Notes to Consolidated Financial Statements
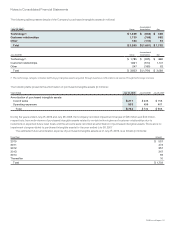
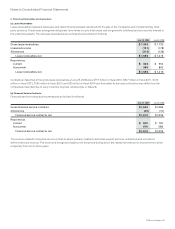
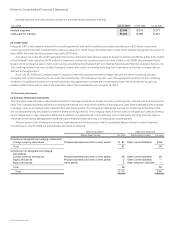
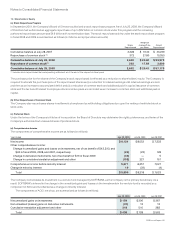
(c) Maturities of Fixed Income Securities
The following table summarizes the maturities of the Company’s fixed income securities at July 25, 2009 (in millions):
Amortized
Cost
Fair
Value
Less than 1 year $16,993 $17,037
Due in 1 to 2 years 6,642 6,709
Due in 2 to 5 years 4,085 4,115
Due after 5 years 567 494
Total $28,287 $28,355
Actual maturities may differ from the contractual maturities because borrowers may have the right to call or prepay certain obligations.
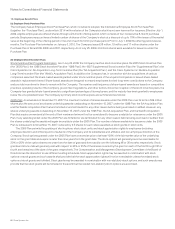
8. Fair Value
SFAS 157 defines fair value as the price that would be received from selling an asset or paid to transfer a liability in an orderly transaction
between market participants at the measurement date. When determining the fair value measurements for assets and liabilities required or
permitted to be recorded at fair value, the Company considers the principal or most advantageous market in which it would transact and it
considers assumptions that market participants would use when pricing the asset or liability.
(a) Fair Value Hierarchy
SFAS 157 requires an entity to maximize the use of observable inputs and minimize the use of unobservable inputs when measuring fair
value. SFAS 157 establishes a fair value hierarchy based on the level of independent, objective evidence surrounding the inputs used to
measure fair value. A financial instrument’s categorization within the fair value hierarchy is based upon the lowest level of input that is
significant to the fair value measurement. SFAS 157 prioritizes the inputs into three levels that may be used to measure fair value:
Level 1 Level 1 applies to assets or liabilities for which there are quoted prices in active markets for identical assets or liabilities.
Level 2 Level 2 applies to assets or liabilities for which there are inputs other than quoted prices that are observable for the asset or liability
such as quoted prices for similar assets or liabilities in active markets; quoted prices for identical assets or liabilities in markets with
insufficient volume or infrequent transactions (less active markets); or model-derived valuations in which significant inputs are observable
or can be derived principally from, or corroborated by, observable market data.
Level 3 Level 3 applies to assets or liabilities for which there are unobservable inputs to the valuation methodology that are significant to
the measurement of the fair value of the assets or liabilities.
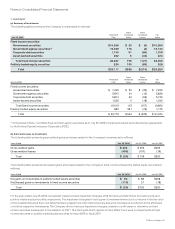
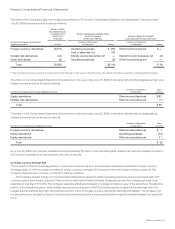
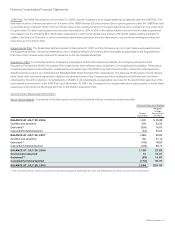
(b) Assets and Liabilities Measured at Fair Value on a Recurring Basis
Assets and liabilities measured at fair value on a recurring basis as of July 25, 2009 were as follows (in millions):
FAIR VALUE MEASUREMENTS USING
Quoted Prices in
Active Markets for
Identical
Instruments
(Level 1)
Significant Other
Observable Inputs
(Level 2)
Significant
Unobservable
Inputs
(Level 3)
Total
Balance
July 25, 2009
Assets:
Money market funds $ 4,514 $ — $ — $ 4,514
Government securities — 10,345 — 10,345
Government agency securities — 16,455 — 16,455
Corporate debt securities — 1,741 — 1,741
Asset-backed securities — — 223 223
Publicly traded equity securities 928 — — 928
Derivative assets — 109 4 113
Total $ 5,442 $ 28,650 $ 227 $ 34,319
Liabilities:
Derivative liabilities $ — $ 66 $ — $ 66
Total $— $ 66 $— $ 66
2009 Annual Report 57