Cisco 2009 Annual Report Download - page 12
Download and view the complete annual report
Please find page 12 of the 2009 Cisco annual report below. You can navigate through the pages in the report by either clicking on the pages listed below, or by using the keyword search tool below to find specific information within the annual report.-
 1
1 -
 2
2 -
 3
3 -
 4
4 -
 5
5 -
 6
6 -
 7
7 -
 8
8 -
 9
9 -
 10
10 -
 11
11 -
 12
12 -
 13
13 -
 14
14 -
 15
15 -
 16
16 -
 17
17 -
 18
18 -
 19
19 -
 20
20 -
 21
21 -
 22
22 -
23
-
24
-
25
-
26
-
27
-
28
-
29
-
30
-
31
-
32
-
33
-
34
-
35
-
36
-
37
-
38
-
39
-
40
-
41
-
42
-
43
-
44
-
45
-
46
-
47
-
48
-
49
-
50
-
51
-
52
-
53
-
54
-
55
-
56
-
57
-
58
-
59
-
60
-
61
-
62
-
63
-
64
-
65
-
66
-
67
-
68
-
69
-
70
-
71
-
72
-
73
-
74
-
75
-
76
-
77
-
78
-
79
-
80
-
81
-
82
-
83
-
84
 |
 |
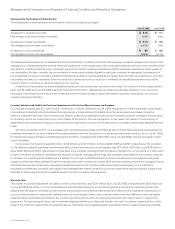
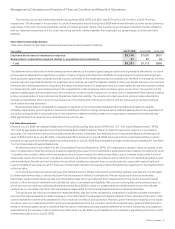
Management’s Discussion and Analysis of Financial Condition and Results of Operations
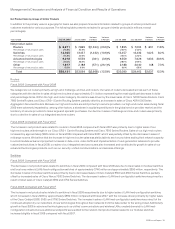
Gross Margin
In fiscal 2009, our gross margin percentage decreased slightly compared with fiscal 2008, reflecting a lower product gross margin
percentage, partially offset by a higher service gross margin percentage. The lower product gross margin percentage was due to higher
sales discounts and rebates, lower product pricing, lower shipment volume and unfavorable product mix, partially offset by lower overall
manufacturing costs. The increase in the service gross margin percentage was primarily due to higher margins for technical support and
advanced services and favorable mix between these categories. Our product and service gross margins may be impacted by economic
downturns or uncertain economic conditions as well as our movement into market adjacencies and could decline if any of the factors that
impact our gross margins are adversely affected in future periods.
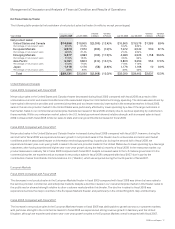
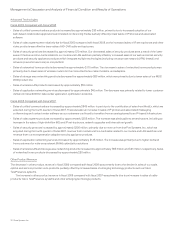
Operating Expenses
During fiscal 2009, we realigned our resources to reduce expenses in response to the macroeconomic environment while maintaining the
focus on our priorities. Operating expenses in fiscal 2009 decreased in absolute dollars, but increased as a percentage of revenue,
compared with fiscal 2008. The decrease in absolute dollars was attributable to lower discretionary expenses, lower variable compensation
expenses, lower acquisition-related compensation expenses, and favorable foreign currency exchange rates. During the second half of
fiscal 2009, we offered an enhanced early retirement program to eligible employees and also undertook limited workforce reduction
actions, which increased our operating expenses.
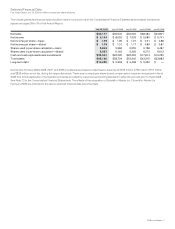
Other Key Financial Measures
The following is a summary of our other key financial measures for fiscal 2009:
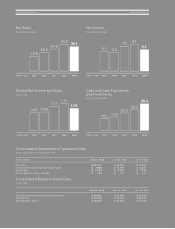
• We generated cash flows from operations of $9.9 billion in fiscal 2009, compared with $12.1 billion in fiscal 2008. Our cash and cash
equivalents, together with our investments, were $35.0 billion at the end of fiscal 2009, compared with $26.2 billion at the end of fiscal
2008.
• Our total deferred revenue at the end of 2009 was $9.4 billion, compared with $8.9 billion at the end of fiscal 2008.
• We repurchased approximately 202 million shares of our common stock at an average price of $17.89 per share for an aggregate
purchase price of $3.6 billion during fiscal 2009.
• Days sales outstanding in accounts receivable (DSO) at the end of fiscal 2009 was 34 days, the same as it was at the end of fiscal 2008.
• Our inventory balance was $1.1 billion at the end of fiscal 2009, compared with $1.2 billion at the end of fiscal 2008. Annualized inventory
turns were 11.7 in the fourth quarter of fiscal 2009, compared with 11.9 in the fourth quarter of fiscal 2008. Our purchase commitments
with contract manufacturers and suppliers were $2.2 billion at the end of fiscal 2009, compared with $2.7 billion at the end of fiscal 2008.
• During the third quarter of fiscal 2009, we completed an offering of senior unsecured notes in an aggregate principal amount of $4.0
billion and retired $500 million of senior unsecured notes when they were due.
• Our backlog at the end of fiscal 2009 was $3.9 billion, compared with $4.8 billion at the end of fiscal 2008.
We believe that our strong cash position and cash flows, our solid balance sheet, our visibility into our supply chain, our high-quality
investment portfolio management, and our financing capabilities together provide a key competitive advantage and collectively have
enabled us to be well positioned to manage our business through the economic downturn that affected us during fiscal 2009, and prepare
for any possible upturn.
10 Cisco Systems, Inc.