Cisco 2009 Annual Report Download - page 23
Download and view the complete annual report
Please find page 23 of the 2009 Cisco annual report below. You can navigate through the pages in the report by either clicking on the pages listed below, or by using the keyword search tool below to find specific information within the annual report.-
 1
1 -
2
-
3
-
4
-
5
-
6
-
7
-
8
-
9
-
10
-
11
-
12
-
 13
13 -
 14
14 -
 15
15 -
 16
16 -
 17
17 -
 18
18 -
 19
19 -
 20
20 -
 21
21 -
 22
22 -
 23
23 -
 24
24 -
 25
25 -
 26
26 -
 27
27 -
 28
28 -
 29
29 -
 30
30 -
 31
31 -
 32
32 -
 33
33 -
34
-
35
-
36
-
37
-
38
-
39
-
40
-
41
-
42
-
43
-
44
-
45
-
46
-
47
-
48
-
49
-
50
-
51
-
52
-
53
-
54
-
55
-
56
-
57
-
58
-
59
-
60
-
61
-
62
-
63
-
64
-
65
-
66
-
67
-
68
-
69
-
70
-
71
-
72
-
73
-
74
-
75
-
76
-
77
-
78
-
79
-
80
-
81
-
82
-
83
-
84
 |
 |

Management’s Discussion and Analysis of Financial Condition and Results of Operations
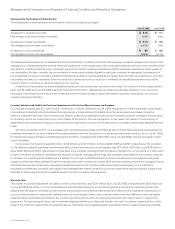
Net Service Revenue
Fiscal 2009 Compared with Fiscal 2008
Net service revenue increased across all of our geographic theaters in fiscal 2009, with particular strength in our Emerging Markets theater.
Higher revenue from technical support service contracts and increased revenue from advanced services relating to consulting services for
specific customer networking needs contributed to the growth in net service revenue in fiscal 2009. The increase in our technical support
revenue was due to a combination of renewals, the amortization of existing technical support service contracts including multiyear service
contracts initiated in prior years, and initiations associated with recent product sales, which have led to a larger installed base of our
equipment being serviced.
Fiscal 2008 Compared with Fiscal 2007
The increase in net service revenue in fiscal 2008 compared with fiscal 2007 was primarily due to increased technical support service
contract initiations and renewals associated with higher product sales, and increased revenue from advanced services. The increase in
advanced services revenue in fiscal 2008, compared with fiscal 2007, was primarily attributable to our revenue growth in the Emerging
Markets theater, advanced technologies products, and our service provider market.
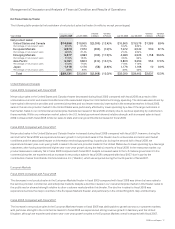
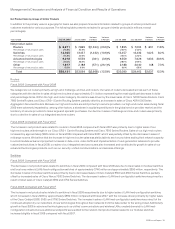
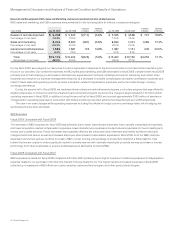
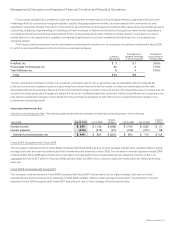
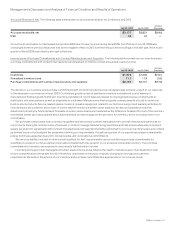
Gross Margin
The following table presents the gross margin for products and services (in millions, except percentages):
AMOUNT PERCENTAGE
Years Ended July 25, 2009 July 26, 2008 July 28, 2007 July 25, 2009 July 26, 2008 July 28, 2007
Gross margin:
Product $18,650 $21,439 $18,895 64.0% 64.8% 64.1%
Service 4,444 3,907 3,364 63.6% 60.7% 61.6%
Total $23,094 $25,346 $22,259 63.9% 64.1% 63.7%
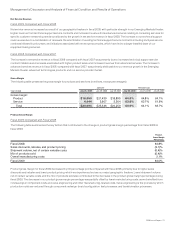
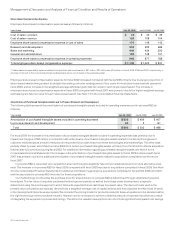
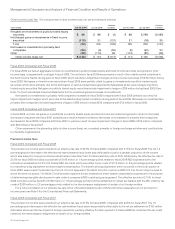
Product Gross Margin
Fiscal 2009 Compared with Fiscal 2008
The following table summarizes the key factors that contributed to the change in product gross margin percentage from fiscal 2008 to
fiscal 2009:
Product
Gross Margin
Percentage
Fiscal 2008 64.8%
Sales discounts, rebates, and product pricing (2.1)%
Shipment volume, net of certain variable costs (0.4)%
Mix of products sold (0.4)%
Overall manufacturing costs 2.1%
Fiscal 2009 64.0%
Product gross margin for fiscal 2009 decreased by 0.8 percentage points compared with fiscal 2008, primarily due to higher sales
discounts and rebates and lower product pricing, which we experienced across our major geographic theaters. Lower shipment volume,
net of certain variable costs, and the mix of products sold also contributed to the decrease in the product gross margin percentage during
fiscal 2009. The decrease in our product gross margin percentage was partially offset by lower manufacturing costs, as we benefited from
cost savings in component costs and value engineering and other manufacturing-related costs. Value engineering is the process by which
production costs are reduced through component redesign, board configuration, test processes, and transformation processes.
2009 Annual Report 21