Cisco 2009 Annual Report Download - page 32
Download and view the complete annual report
Please find page 32 of the 2009 Cisco annual report below. You can navigate through the pages in the report by either clicking on the pages listed below, or by using the keyword search tool below to find specific information within the annual report.-
 1
1 -
2
-
3
-
4
-
5
-
6
-
7
-
8
-
9
-
10
-
11
-
12
-
13
-
14
-
15
-
16
-
17
-
18
-
19
-
20
-
21
-
 22
22 -
 23
23 -
 24
24 -
 25
25 -
 26
26 -
 27
27 -
 28
28 -
 29
29 -
 30
30 -
 31
31 -
 32
32 -
 33
33 -
 34
34 -
 35
35 -
 36
36 -
 37
37 -
 38
38 -
 39
39 -
 40
40 -
 41
41 -
 42
42 -
43
-
44
-
45
-
46
-
47
-
48
-
49
-
50
-
51
-
52
-
53
-
54
-
55
-
56
-
57
-
58
-
59
-
60
-
61
-
62
-
63
-
64
-
65
-
66
-
67
-
68
-
69
-
70
-
71
-
72
-
73
-
74
-
75
-
76
-
77
-
78
-
79
-
80
-
81
-
82
-
83
-
84
 |
 |

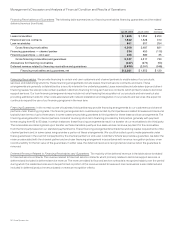
Management’s Discussion and Analysis of Financial Condition and Results of Operations
Liquidity and Capital Resources
The following sections discuss the effects of changes in our balance sheet, contractual obligations, other commitments, and the stock
repurchase program on our liquidity and capital resources. In the difficult macroeconomic environment during fiscal 2009, we maintained
our strong financial position by monitoring and mitigating risks with respect to our investment portfolio and other working capital-related
areas. With regard to receivables, we continued to apply our credit standards and policies in making our financial decisions. We also
continued to review our inventory and purchase commitments to ensure that the balances were appropriate relative to our lower revenue
levels during fiscal 2009. We continued to maintain a strong cash position and a high-quality investment portfolio. Because of the above
measures, we believe that the global economic downturn during fiscal 2009 did not materially and adversely impact the quality of our
investment portfolio and working capital as of July 25, 2009.
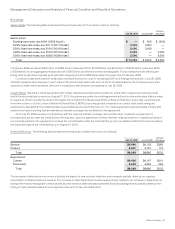
Balance Sheet and Cash Flows
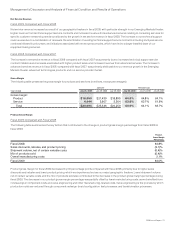
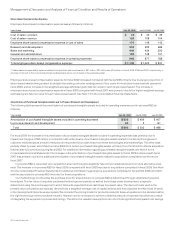
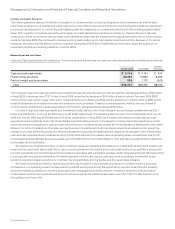
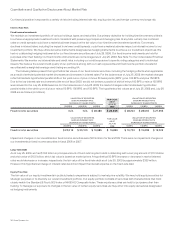
Cash and Cash Equivalents and Investments The following table summarizes our cash and cash equivalents and investments (in millions):
July 25, 2009 July 26, 2008
Increase
(Decrease)
Cash and cash equivalents $ 5,718 $ 5,191 $ 527
Fixed income securities 28,355 19,869 8,486
Publicly traded equity securities 928 1,175 (247)
Total $35,001 $26,235 $8,766
The increase in cash and cash equivalents and investments was primarily the result of cash provided by operating activities of $9.9 billion
in fiscal 2009, a decrease from $12.1 billion in fiscal 2008, as well as the issuance of $4.0 billion of senior notes in February 2009 ($500
million of which was used to repay other senior notes that were due in February 2009), and the issuance of common stock of $863 million
related to employee stock option exercises and employee stock purchases. These factors were partially offset by the repurchase of
common stock of $3.6 billion, capital expenditures of $1.0 billion, and acquisitions totaling $426 million.
Our total in cash and cash equivalents and investments held outside of the United States in various foreign subsidiaries was $29.1
billion and $24.4 billion, as of July 25, 2009 and July 26, 2008, respectively. The remaining balance held in the United States as of July 25,
2009 and July 26, 2008 was $5.9 billion and $1.8 billion, respectively. In fiscal 2009, the increase in the balance of total cash and cash
equivalents and investments held in the United States was attributable primarily to the issuance of senior notes discussed above. Under
current tax laws and regulations, if cash and cash equivalents and investments held outside the United States are distributed to the United
States in the form of dividends or otherwise, we may be subject to additional U.S. income taxes (subject to an adjustment for foreign tax
credits) and foreign withholding taxes. For internal management purposes, we target specific ranges of net realizable cash, representing
cash and cash equivalents and investments, net of (i) long-term debt and the present value of operating lease commitments, and (ii) U.S.
income taxes that we estimate would be payable upon the distribution to the United States of cash and cash equivalents and investments
held outside the United States.
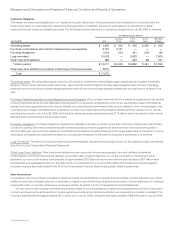
We maintain an investment portfolio of various holdings, types, and maturities. We classify our investments as short term investments
based on their nature and their availability for use in current operations. We believe the overall credit quality of our portfolio is strong, with
our cash equivalents and fixed income portfolio invested in securities with a weighted-average credit rating exceeding AA. We believe that
our strong cash and cash equivalents and investments position allows us to use our cash resources for strategic investments to gain
access to new technologies, acquisitions, customer financing activities, working capital, and the repurchase of shares.
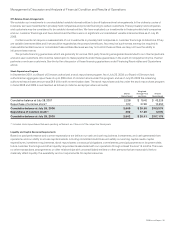
We expect that cash provided by operating activities may fluctuate in future periods as a result of a number of factors, including
fluctuations in our operating results, the rate at which products are shipped during the period (which we refer to as shipment linearity),
accounts receivable collections, inventory and supply chain management, deferred revenue, excess tax benefits from share-based
compensation, and the timing and amount of tax and other payments. For additional discussion, see “Part I, Item 1A. Risk Factors” in our
Annual Report on Form 10-K.
30 Cisco Systems, Inc.