Cisco 2009 Annual Report Download - page 55
Download and view the complete annual report
Please find page 55 of the 2009 Cisco annual report below. You can navigate through the pages in the report by either clicking on the pages listed below, or by using the keyword search tool below to find specific information within the annual report.-
 1
1 -
2
-
3
-
4
-
5
-
6
-
7
-
8
-
9
-
10
-
11
-
12
-
13
-
14
-
15
-
16
-
17
-
18
-
19
-
20
-
21
-
22
-
23
-
24
-
25
-
26
-
27
-
28
-
29
-
30
-
31
-
32
-
33
-
34
-
35
-
36
-
37
-
38
-
39
-
40
-
41
-
42
-
43
-
44
-
 45
45 -
 46
46 -
 47
47 -
 48
48 -
 49
49 -
 50
50 -
 51
51 -
 52
52 -
 53
53 -
 54
54 -
 55
55 -
 56
56 -
 57
57 -
 58
58 -
 59
59 -
 60
60 -
 61
61 -
 62
62 -
 63
63 -
 64
64 -
 65
65 -
66
-
67
-
68
-
69
-
70
-
71
-
72
-
73
-
74
-
75
-
76
-
77
-
78
-
79
-
80
-
81
-
82
-
83
-
84
 |
 |

Notes to Consolidated Financial Statements
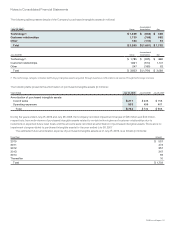
6. Financing Receivables and Guarantees
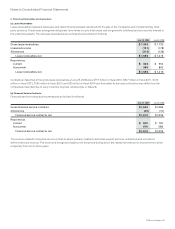
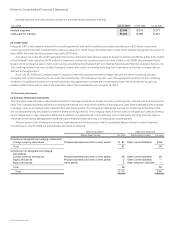
(a) Lease Receivables
Lease receivables represent sales-type and direct-financing leases resulting from the sale of the Company’s and complementary third-
party products. These lease arrangements typically have terms of up to three years and are generally collateralized by a security interest in
the underlying assets. The net lease receivables are summarized as follows (in millions):
July 25, 2009 July 26, 2008
Gross lease receivables $ 1,996 $ 1,730
Unearned income (191) (178)
Allowances (213) (136)
Lease receivables, net $ 1,592 $ 1,416
Reported as:
Current $ 626 $ 554
Noncurrent 966 862
Lease receivables, net $ 1,592 $ 1,416
Contractual maturities of the gross lease receivables at July 25, 2009 were $757 million in fiscal 2010, $607 million in fiscal 2011, $374
million in fiscal 2012, $195 million in fiscal 2013, and $63 million in fiscal 2014 and thereafter. Actual cash collections may differ from the
contractual maturities due to early customer buyouts, refinancings, or defaults.
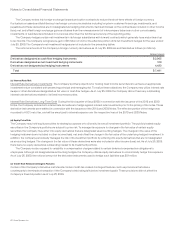
(b) Financed Service Contracts
Financed service contracts are summarized as follows (in millions):
July 25, 2009 July 26, 2008
Gross financed service contracts $1,642 $1,328
Allowances (26) (10)
Financed service contracts, net $1,616 $1,318
Reported as:
Current $ 940 $ 730
Noncurrent 676 588
Financed service contracts, net $1,616 $1,318
The revenue related to financed service contracts, which primarily relates to technical support services, is deferred and included in
deferred service revenue. The revenue is recognized ratably over the period during which the related services are to be performed, which
is typically from one to three years.
2009 Annual Report 53