Cisco 2009 Annual Report Download - page 57
Download and view the complete annual report
Please find page 57 of the 2009 Cisco annual report below. You can navigate through the pages in the report by either clicking on the pages listed below, or by using the keyword search tool below to find specific information within the annual report.-
 1
1 -
2
-
3
-
4
-
5
-
6
-
7
-
8
-
9
-
10
-
11
-
12
-
13
-
14
-
15
-
16
-
17
-
18
-
19
-
20
-
21
-
22
-
23
-
24
-
25
-
26
-
27
-
28
-
29
-
30
-
31
-
32
-
33
-
34
-
35
-
36
-
37
-
38
-
39
-
40
-
41
-
42
-
43
-
44
-
45
-
46
-
 47
47 -
 48
48 -
 49
49 -
 50
50 -
 51
51 -
 52
52 -
 53
53 -
 54
54 -
 55
55 -
 56
56 -
 57
57 -
 58
58 -
 59
59 -
 60
60 -
 61
61 -
 62
62 -
 63
63 -
 64
64 -
 65
65 -
 66
66 -
 67
67 -
68
-
69
-
70
-
71
-
72
-
73
-
74
-
75
-
76
-
77
-
78
-
79
-
80
-
81
-
82
-
83
-
84
 |
 |

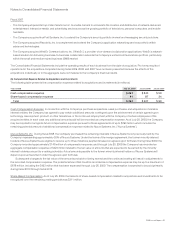
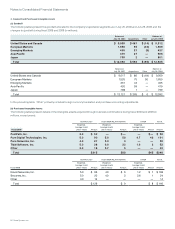
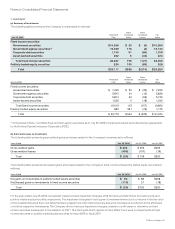
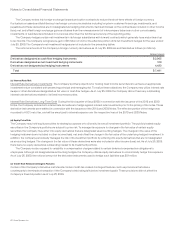
Notes to Consolidated Financial Statements
7. Investments
(a) Summary of Investments
The following tables summarize the Company’s investments (in millions):
Amortized
Cost
Gross
Unrealized
Gains
Gross
Unrealized
Losses
Fair
ValueJuly 25, 2009
Fixed income securities:
Government securities $10,266 $ 23 $ (5) $10,284
Government agency securities(1) 16,029 116 (2) 16,143
Corporate debt securities 1,740 51 (86) 1,705
Asset-backed securities 252 5 (34) 223
Total fixed income securities 28,287 195 (127) 28,355
Publicly traded equity securities 824 193 (89) 928
Total $29,111 $388 $(216) $29,283
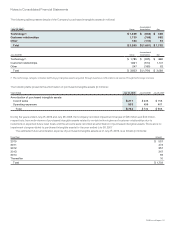
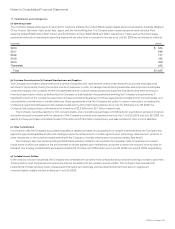
Amortized
Cost
Gross
Unrealized
Gains
Gross
Unrealized
Losses
Fair
ValueJuly 26, 2008
Fixed income securities:
Government securities $ 7,249 $ 50 $ (33) $ 7,266
Government agency securities 5,815 34 (10) 5,839
Corporate debt securities 5,814 24 (96) 5,742
Asset-backed securities 1,035 5 (18) 1,022
Total fixed income securities 19,913 113 (157) 19,869
Publicly traded equity securities 860 391 (76) 1,175
Total $ 20,773 $ 504 $ (233) $ 21,044
(1) In the tables in Note 7 and Note 8, government agency securities as of July 25, 2009 include bank-issued securities that are guaranteed
by the Federal Deposit Insurance Corporation (FDIC).
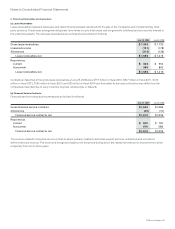
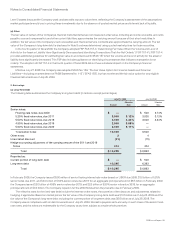
(b) Gains and Losses on Investments
The following table presents gross realized gains and losses related to the Company’s investments (in millions):
Years Ended July 25, 2009 July 26, 2008 July 28, 2007
Gross realized gains $ 435 $ 306 $269
Gross realized losses (459) (197) (19)
Total $ (24) $ 109 $250
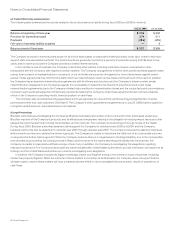
The following table presents net realized gains and losses related to the Company’s fixed income and publicly traded equity securities (in
millions):
Years Ended July 25, 2009 July 26, 2008 July 28, 2007
Net gains on investments in publicly traded equity securities $86 $ 88 $268
Net (losses) gains on investments in fixed income securities (110) 21 (18)
Total $ (24) $109 $250
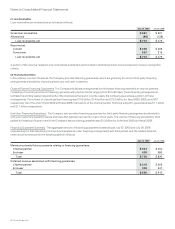
For the year ended July 25, 2009, net realized losses included impairment charges of $219 million and $39 million for fixed income and
publicly traded equity securities, respectively. The impairment charges for both types of investments were due to a decline in the fair value
of the investments below their cost basis that were judged to be other than temporary and were recorded as a reduction to the amortized
cost of the respective investments. The Company did not have any impairment charges, related to credit losses or otherwise, on fixed
income securities subsequent to the adoption of FSP 115-2 during the fourth quarter of fiscal 2009. There were no impairments of fixed
income securities or publicly traded equity securities for fiscal 2008 or fiscal 2007.
2009 Annual Report 55