Cisco 2009 Annual Report Download - page 70
Download and view the complete annual report
Please find page 70 of the 2009 Cisco annual report below. You can navigate through the pages in the report by either clicking on the pages listed below, or by using the keyword search tool below to find specific information within the annual report.-
 1
1 -
2
-
3
-
4
-
5
-
6
-
7
-
8
-
9
-
10
-
11
-
12
-
13
-
14
-
15
-
16
-
17
-
18
-
19
-
20
-
21
-
22
-
23
-
24
-
25
-
26
-
27
-
28
-
29
-
30
-
31
-
32
-
33
-
34
-
35
-
36
-
37
-
38
-
39
-
40
-
41
-
42
-
43
-
44
-
45
-
46
-
47
-
48
-
49
-
50
-
51
-
52
-
53
-
54
-
55
-
56
-
57
-
58
-
59
-
 60
60 -
 61
61 -
 62
62 -
 63
63 -
 64
64 -
 65
65 -
 66
66 -
 67
67 -
 68
68 -
 69
69 -
 70
70 -
 71
71 -
 72
72 -
 73
73 -
 74
74 -
 75
75 -
 76
76 -
 77
77 -
 78
78 -
 79
79 -
 80
80 -
81
-
82
-
83
-
84
 |
 |
Notes to Consolidated Financial Statements
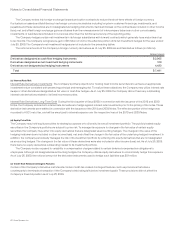
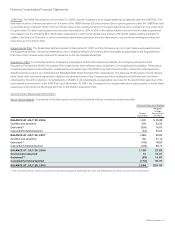
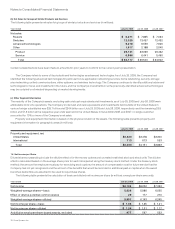
The following table summarizes significant ranges of outstanding and exercisable stock options as of July 25, 2009 (in millions, except
years and share prices):
STOCK OPTIONS OUTSTANDING STOCK OPTIONS EXERCISABLE
Range of Exercise Prices
Number
Outstanding
Weighted-
Average
Remaining
Contractual
Life
(in Years)
Weighted-
Average
Exercise
Price per
Share
Aggregate
Intrinsic
Value
Number
Exercisable
Weighted-
Average
Exercise
Price per
Share
Aggregate
Intrinsic
Value
$ 0.01 – 15.00 82 2.92 $11.00 $ 894 77 $11.22 $ 800
15.01 – 18.00 179 3.98 17.29 820 143 17.17 677
18.01 – 20.00 244 3.58 19.22 650 227 19.22 603
20.01 – 25.00 219 5.01 22.42 73 145 22.27 61
25.01 – 35.00 174 6.83 30.54 — 70 30.32 —
35.01 – 68.56 106 0.31 51.62 — 106 51.62 —
Total 1,004 4.13 $24.29 $2,437 768 $24.16 $2,141
The aggregate intrinsic value in the preceding table represents the total pretax intrinsic value, based on the Company’s closing stock price
of $21.88 as of July 24, 2009, which would have been received by the option holders had those option holders exercised their stock
options as of that date. The total number of in-the-money stock options exercisable as of July 25, 2009 was 496 million. As of July 26, 2008,
795 million outstanding stock options were exercisable and the weighted-average exercise price was $29.53.
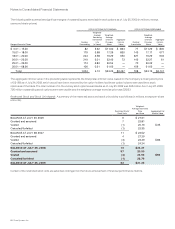
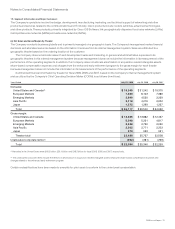
Restricted Stock and Stock Unit Awards A summary of the restricted stock and stock unit activity is as follows (in millions, except per-share
amounts):
Restricted Stock/
Stock Units
Weighted-
Average Grant Date
Price
per Share
Aggregated Fair
Market Value
BALANCE AT JULY 29, 2006 6 $ 21.61
Granted and assumed 7 22.81
Vested (1) 20.16 $ 35
Canceled/forfeited (1) 22.35
BALANCE AT JULY 28, 2007 11 $ 22.52
Granted and assumed 4 27.29
Vested (4) 22.49 $ 83
Canceled/forfeited (1) 24.24
BALANCE AT JULY 26, 2008 10 $24.27
Granted and assumed 57 20.90
Vested (4) 23.56 $69
Canceled/forfeited (1) 22.76
BALANCE AT JULY 25, 2009 62 $21.25
Certain of the restricted stock units are awarded contingent on the future achievement of financial performance metrics.
68 Cisco Systems, Inc.