Cisco 2009 Annual Report Download - page 39
Download and view the complete annual report
Please find page 39 of the 2009 Cisco annual report below. You can navigate through the pages in the report by either clicking on the pages listed below, or by using the keyword search tool below to find specific information within the annual report.-
 1
1 -
2
-
3
-
4
-
5
-
6
-
7
-
8
-
9
-
10
-
11
-
12
-
13
-
14
-
15
-
16
-
17
-
18
-
19
-
20
-
21
-
22
-
23
-
24
-
25
-
26
-
27
-
28
-
 29
29 -
 30
30 -
 31
31 -
 32
32 -
 33
33 -
 34
34 -
 35
35 -
 36
36 -
 37
37 -
 38
38 -
 39
39 -
 40
40 -
 41
41 -
 42
42 -
 43
43 -
 44
44 -
 45
45 -
 46
46 -
 47
47 -
 48
48 -
 49
49 -
50
-
51
-
52
-
53
-
54
-
55
-
56
-
57
-
58
-
59
-
60
-
61
-
62
-
63
-
64
-
65
-
66
-
67
-
68
-
69
-
70
-
71
-
72
-
73
-
74
-
75
-
76
-
77
-
78
-
79
-
80
-
81
-
82
-
83
-
84
 |
 |
Quantitative and Qualitative Disclosures About Market Risk
Publicly Traded Equity Securities
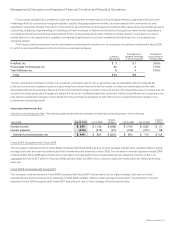
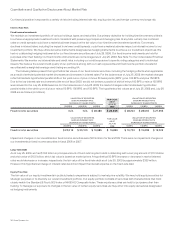
The following tables present the hypothetical fair values of publicly traded equity securities as a result of selected potential decreases and
increases in the price of each equity security in the portfolio, excluding hedged equity securities, if any. Potential fluctuations in the price of
each equity security in the portfolio of plus or minus 10%, 20%, and 30% were selected based on potential near-term changes in those
security prices. The hypothetical fair values as of July 25, 2009 and July 26, 2008 are as follows (in millions):
VALUATION OF SECURITIES
GIVEN AN X% DECREASE IN
EACH STOCK’S PRICE
FAIR VALUE
AS OF
JULY 25,
2009
VALUATION OF SECURITIES GIVEN
AN X% INCREASE IN EACH STOCK’S
PRICE
(30%) (20%) (10%) 10% 20% 30%
Publicly traded equity securities $ 650 $ 742 $ 835 $ 928 $ 1,021 $ 1,114 $ 1,206
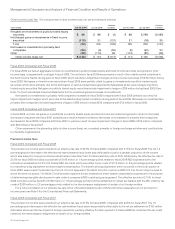
VALUATION OF SECURITIES
GIVEN AN X% DECREASE IN
EACH STOCK’S PRICE
FAIR VALUE
AS OF
JULY 26,
2008
VALUATION OF SECURITIES GIVEN
AN X% INCREASE IN EACH STOCK’S
PRICE
(30%) (20%) (10%) 10% 20% 30%
Publicly traded equity securities $ 736 $ 842 $ 947 $ 1,052 $ 1,157 $ 1,262 $ 1,368
Impairment charges on our investments in publicly traded equity securities were $39 million for fiscal 2009. There were no impairment
charges on our investments in publicly traded equity securities in fiscal 2008 or 2007.
Investments in Privately Held Companies
We have also invested in privately held companies. These investments are recorded in other assets in our Consolidated Balance Sheet
and are accounted for either at cost or the equity method. As of July 25, 2009, the total carrying amount of our investments in privately held
companies was $709 million, compared with $706 million at July 26, 2008. Some of the privately held companies in which we invested are
in the startup or development stages. These investments are inherently risky because the markets for the technologies or products these
companies are developing are typically in the early stages and may never materialize. We could lose our entire investment in these
companies. Our evaluation of investments in privately held companies is based on the fundamentals of the businesses, including, among
other factors, the nature of their technologies and potential for financial return. Our impairment charges on investments in privately held
companies were $85 million, $12 million, and $22 million for fiscal 2009, 2008 and 2007, respectively.
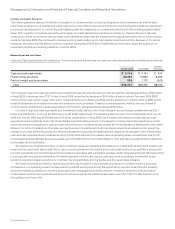
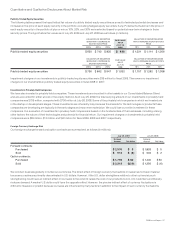
Foreign Currency Exchange Risk
Our foreign exchange forward and option contracts are summarized as follows (in millions):
July 25, 2009 July 26, 2008
Notional
Amount Fair Value
Notional
Amount Fair Value
Forward contracts:
Purchased $ 2,570 $ 5 $ 1,803 $ 5
Sold $ 912 $ (8) $ 902 $ 2
Option contracts:
Purchased $ 1,796 $ 82 $ 1,440 $ 50
Sold $ 2,213 $(36) $ 1,256 $ (6)
We conduct business globally in numerous currencies. The direct effect of foreign currency fluctuations on sales has not been material
because our sales are primarily denominated in U.S. dollars. However, if the U.S. dollar strengthens relative to other currencies, such
strengthening could have an indirect effect on our sales to the extent it raises the cost of our products to non-U.S. customers and thereby
reduces demand. A weaker U.S. dollar could have the opposite effect. However, the precise indirect effect of currency fluctuations is
difficult to measure or predict because our sales are influenced by many factors in addition to the impact of such currency fluctuations.
2009 Annual Report 37