Cisco 2009 Annual Report Download - page 44
Download and view the complete annual report
Please find page 44 of the 2009 Cisco annual report below. You can navigate through the pages in the report by either clicking on the pages listed below, or by using the keyword search tool below to find specific information within the annual report.-
 1
1 -
2
-
3
-
4
-
5
-
6
-
7
-
8
-
9
-
10
-
11
-
12
-
13
-
14
-
15
-
16
-
17
-
18
-
19
-
20
-
21
-
22
-
23
-
24
-
25
-
26
-
27
-
28
-
29
-
30
-
31
-
32
-
33
-
 34
34 -
 35
35 -
 36
36 -
 37
37 -
 38
38 -
 39
39 -
 40
40 -
 41
41 -
 42
42 -
 43
43 -
 44
44 -
 45
45 -
 46
46 -
 47
47 -
 48
48 -
 49
49 -
 50
50 -
 51
51 -
 52
52 -
 53
53 -
 54
54 -
55
-
56
-
57
-
58
-
59
-
60
-
61
-
62
-
63
-
64
-
65
-
66
-
67
-
68
-
69
-
70
-
71
-
72
-
73
-
74
-
75
-
76
-
77
-
78
-
79
-
80
-
81
-
82
-
83
-
84
 |
 |

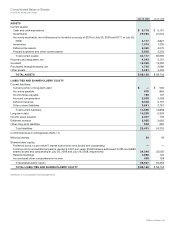
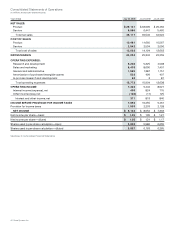
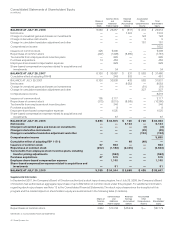
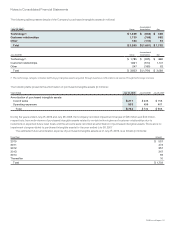
Consolidated Statements of Shareholders’ Equity
(in millions)
Shares of
Common
Stock
Common Stock
and
Additional
Paid-In Capital
Retained
Earnings
(Accumulated
Deficit)
Accumulated
Other
Comprehensive
Income
Total
Shareholders’
Equity
BALANCE AT JULY 29, 2006 6,059 $ 24,257 $ (617) $ 272 $ 23,912
Net income — — 7,333 — 7,333
Change in unrealized gains and losses on investments — — — 124 124
Change in derivative instruments — — — 5 5
Change in cumulative translation adjustment and other — — — 161 161
Comprehensive income 7,623
Issuance of common stock 325 5,306 — — 5,306
Repurchase of common stock (297) (1,296) (6,485) — (7,781)
Tax benefits from employee stock incentive plans — 995 — — 995
Purchase acquisitions 13 462 — — 462
Employee share-based compensation expense — 929 — — 929
Share-based compensation expense related to acquisitions and
investments — 34 — — 34
BALANCE AT JULY 28, 2007 6,100 $ 30,687 $ 231 $ 562 $ 31,480
Cumulative effect of adopting FIN 48 — 249 202 — 451
BALANCE AT JULY 29, 2007 6,100 30,936 433 562 31,931
Net income — — 8,052 — 8,052
Change in unrealized gains and losses on investments — — — (61) (61)
Change in cumulative translation adjustment and other — — — 227 227
Comprehensive income 8,218
Issuance of common stock 165 3,117 — — 3,117
Repurchase of common stock (372) (2,015) (8,365) — (10,380)
Tax benefits from employee stock incentive plans — 346 — — 346
Purchase acquisitions — 9 — — 9
Employee share-based compensation expense — 1,025 — — 1,025
Share-based compensation expense related to acquisitions and
investments — 87 — — 87
BALANCE AT JULY 26, 2008 5,893 $ 33,505 $ 120 $ 728 $ 34,353
Net income — — 6,134 — 6,134
Change in unrealized gains and losses on investments — — — (3) (3)
Change in derivative instruments — — — (49) (49)
Change in cumulative translation adjustment and other — — — (192) (192)
Comprehensive income 5,890
Cumulative effect of adopting FSP 115-2 — — 49 (49) —
Issuance of common stock 67 863 — — 863
Repurchase of common stock (202) (1,188) (2,435) — (3,623)
Tax benefits from employee stock incentive plans, including
transfer pricing adjustments — (582) — — (582)
Purchase acquisitions 27 515 — — 515
Employee share-based compensation expense — 1,140 — — 1,140
Share-based compensation expense related to acquisitions and
investments — 91 — — 91
BALANCE AT JULY 25, 2009 5,785 $ 34,344 $ 3,868 $ 435 $ 38,647
Supplemental Information
In September 2001, the Company’s Board of Directors authorized a stock repurchase program. As of July 25, 2009, the Company’s Board
of Directors had authorized an aggregate repurchase of up to $62 billion of common stock under this program. For additional information
regarding stock repurchases, see Note 12 to the Consolidated Financial Statements. The stock repurchases since the inception of this
program and the related impact on shareholders’ equity are summarized in the following table (in millions):
Shares of
Common
Stock
Common Stock
and
Additional
Paid-In Capital
Retained
Earnings
(Accumulated
Deficit)
Accumulated
Other
Comprehensive
Income
Total
Shareholders’
Equity
Repurchases of common stock 2,802 $10,740 $46,439 $— $57,179
See Notes to Consolidated Financial Statements.
42 Cisco Systems, Inc.