Cisco 2009 Annual Report Download - page 15
Download and view the complete annual report
Please find page 15 of the 2009 Cisco annual report below. You can navigate through the pages in the report by either clicking on the pages listed below, or by using the keyword search tool below to find specific information within the annual report.-
 1
1 -
2
-
3
-
4
-
 5
5 -
 6
6 -
 7
7 -
 8
8 -
 9
9 -
 10
10 -
 11
11 -
 12
12 -
 13
13 -
 14
14 -
 15
15 -
 16
16 -
 17
17 -
 18
18 -
 19
19 -
 20
20 -
 21
21 -
 22
22 -
 23
23 -
 24
24 -
 25
25 -
26
-
27
-
28
-
29
-
30
-
31
-
32
-
33
-
34
-
35
-
36
-
37
-
38
-
39
-
40
-
41
-
42
-
43
-
44
-
45
-
46
-
47
-
48
-
49
-
50
-
51
-
52
-
53
-
54
-
55
-
56
-
57
-
58
-
59
-
60
-
61
-
62
-
63
-
64
-
65
-
66
-
67
-
68
-
69
-
70
-
71
-
72
-
73
-
74
-
75
-
76
-
77
-
78
-
79
-
80
-
81
-
82
-
83
-
84
 |
 |

Management’s Discussion and Analysis of Financial Condition and Results of Operations
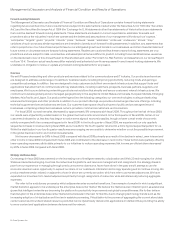
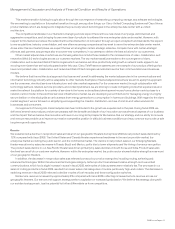
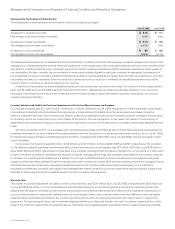
The provision for product warranties issued during fiscal 2009, 2008, and 2007 was $374 million, $511 million, and $510 million,
respectively. The decrease in the provision for product warranties issued during fiscal 2009 was driven primarily by lower product revenue,
a decrease in the cost of servicing warranty claims, and lower warranty claims. If we experience an increase in warranty claims compared
with our historical experience, or if the cost of servicing warranty claims is greater than expected, our gross margin could be adversely
affected.
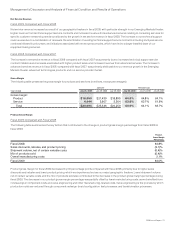
Share-Based Compensation Expense
Total share-based compensation expenses are summarized as follows (in millions):
Years Ended July 25, 2009 July 26, 2008 July 28, 2007
Employee share-based compensation expense $1,140 $1,025 $931
Share-based compensation expense related to acquisitions and investments 91 87 34
Total $1,231 $1,112 $965
The determination of fair value of share-based payment awards on the date of grant using an option-pricing model is affected by our stock
price as well as assumptions regarding a number of highly complex and subjective variables. For employee stock options and employee
stock purchase rights, these variables include, but are not limited to, the expected stock price volatility over the term of the awards, risk-free
interest rate and expected dividends. For employee stock options, we used the implied volatility for two-year traded options on our stock as
the expected volatility assumption required in the lattice-binomial model. For employee stock purchase rights, we used the implied volatility
for traded options (with lives corresponding to the expected life of the employee stock purchase rights) on our stock. The selection of the
implied volatility approach was based upon the availability of actively traded options on our stock and our assessment that implied volatility
is more representative of future stock price trends than historical volatility. The valuation of employee stock options is also impacted by
kurtosis, and skewness, which are technical measures of the distribution of stock price returns, and the actual and projected employee
stock option exercise behaviors.
Because share-based compensation expense recognized in the Consolidated Statements of Operations is based on awards
ultimately expected to vest, it has been reduced for forfeitures. If factors change and we employ different assumptions in the application of
our option-pricing model in future periods or if we experience different forfeiture rates, the compensation expense that is derived may
differ significantly from what we have recorded in the current year.
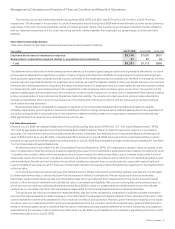
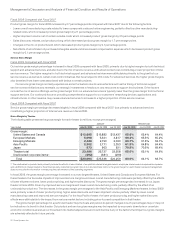
Fair Value Measurements
Effective July 27, 2008, we adopted Statement of Financial Accounting Standards (“SFAS”) No. 157, “Fair Value Measurements” (“SFAS
157”) and its applicable Financial Accounting Standards Board Staff Positions (“FSPs”) in determining the fair value of our investment
securities. Our fixed income and publicly traded equity securities, collectively, are reflected in the Consolidated Balance Sheets at a fair
value of $29.3 billion as of July 25, 2009, compared with $21.0 billion as of July 26, 2008. Our fixed income investment portfolio consists
primarily of high-quality investment grade securities and as of July 25, 2009 had a weighted-average credit rating exceeding AA. See Note
7 to the Consolidated Financial Statements.
As described more fully in Note 8 to the Consolidated Financial Statements, SFAS 157 establishes a valuation hierarchy based on the
level of independent, objective evidence available regarding the value of the investments. It establishes three classes of investments: Level
1 consists of securities for which there are quoted prices in active markets for identical securities; Level 2 consists of securities for which
observable inputs other than Level 1 inputs are used, such as prices for similar securities in active markets or for identical securities in less
active markets and model-derived valuations for which the variables are derived from, or corroborated by, observable market data; and
Level 3 consists of securities for which there are unobservable inputs to the valuation methodology that are significant to the measurement
of the fair value.
Our Level 2 securities are valued using quoted market prices for similar instruments, nonbinding market prices that are corroborated
by observable market data, or discounted cash flow techniques in limited circumstances. We use inputs such as actual trade data,
benchmark yields, broker/dealer quotes, and other similar data, which are obtained from independent pricing vendors, quoted market
prices, or other sources to determine the ultimate fair value of our assets and liabilities. We use such pricing data as the primary input, to
which we have not made any material adjustments during fiscal 2009 to make our assessments and determinations as to the ultimate
valuation of our investment portfolio. We are ultimately responsible for the financial statements and underlying estimates.
The inputs and fair value are reviewed for reasonableness, may be further validated by comparison to publicly available information
and could be adjusted based on market indices or other information that management deems material to their estimate of fair value. In the
current market environment, the assessment of fair value can be difficult and subjective. However, given the relative reliability of the inputs
we use to value our investment portfolio, and because substantially all of our valuation inputs are obtained using quoted market prices for
similar or identical assets, we do not believe that the nature of estimates and assumptions affected by levels of subjectivity and judgment
was material to the valuation of the investment portfolio as of July 25, 2009. Level 3 assets do not represent a significant portion of our total
investment portfolio as of July 25, 2009.
2009 Annual Report 13