Cisco 2009 Annual Report Download - page 42
Download and view the complete annual report
Please find page 42 of the 2009 Cisco annual report below. You can navigate through the pages in the report by either clicking on the pages listed below, or by using the keyword search tool below to find specific information within the annual report.-
 1
1 -
2
-
3
-
4
-
5
-
6
-
7
-
8
-
9
-
10
-
11
-
12
-
13
-
14
-
15
-
16
-
17
-
18
-
19
-
20
-
21
-
22
-
23
-
24
-
25
-
26
-
27
-
28
-
29
-
30
-
31
-
 32
32 -
 33
33 -
 34
34 -
 35
35 -
 36
36 -
 37
37 -
 38
38 -
 39
39 -
 40
40 -
 41
41 -
 42
42 -
 43
43 -
 44
44 -
 45
45 -
 46
46 -
 47
47 -
 48
48 -
 49
49 -
 50
50 -
 51
51 -
 52
52 -
53
-
54
-
55
-
56
-
57
-
58
-
59
-
60
-
61
-
62
-
63
-
64
-
65
-
66
-
67
-
68
-
69
-
70
-
71
-
72
-
73
-
74
-
75
-
76
-
77
-
78
-
79
-
80
-
81
-
82
-
83
-
84
 |
 |

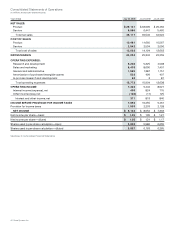
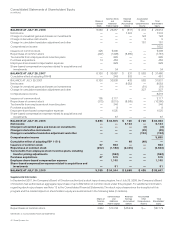
Consolidated Statements of Operations
(in millions, except per-share amounts)
Years Ended July 25, 2009 July 26, 2008 July 28, 2007
NET SALES:
Product $ 29,131 $ 33,099 $ 29,462
Service 6,986 6,441 5,460
Total net sales 36,117 39,540 34,922
COST OF SALES:
Product 10,481 11,660 10,567
Service 2,542 2,534 2,096
Total cost of sales 13,023 14,194 12,663
GROSS MARGIN 23,094 25,346 22,259
OPERATING EXPENSES:
Research and development 5,208 5,325 4,598
Sales and marketing 8,403 8,690 7,401
General and administrative 1,565 1,387 1,151
Amortization of purchased intangible assets 533 499 407
In-process research and development 63 381
Total operating expenses 15,772 15,904 13,638
OPERATING INCOME 7,322 9,442 8,621
Interest income (expense), net 499 824 715
Other income (loss), net (128) (11) 125
Interest and other income, net 371 813 840
INCOME BEFORE PROVISION FOR INCOME TAXES 7,693 10,255 9,461
Provision for income taxes 1,559 2,203 2,128
NET INCOME $ 6,134 $ 8,052 $ 7,333
Net income per share—basic $ 1.05 $ 1.35 $ 1.21
Net income per share—diluted $ 1.05 $ 1.31 $ 1.17
Shares used in per-share calculation—basic 5,828 5,986 6,055
Shares used in per-share calculation—diluted 5,857 6,163 6,265
See Notes to Consolidated Financial Statements.
40 Cisco Systems, Inc.