Cablevision 2011 Annual Report Download - page 96
Download and view the complete annual report
Please find page 96 of the 2011 Cablevision annual report below. You can navigate through the pages in the report by either clicking on the pages listed below, or by using the keyword search tool below to find specific information within the annual report.-
 1
1 -
2
-
3
-
4
-
5
-
6
-
7
-
8
-
9
-
10
-
11
-
12
-
13
-
14
-
15
-
16
-
17
-
18
-
19
-
20
-
21
-
22
-
23
-
24
-
25
-
26
-
27
-
28
-
29
-
30
-
31
-
32
-
33
-
34
-
35
-
36
-
37
-
38
-
39
-
40
-
41
-
42
-
43
-
44
-
45
-
46
-
47
-
48
-
49
-
50
-
51
-
52
-
53
-
54
-
55
-
56
-
57
-
58
-
59
-
60
-
61
-
62
-
63
-
64
-
65
-
66
-
67
-
68
-
69
-
70
-
71
-
72
-
73
-
74
-
75
-
76
-
77
-
78
-
79
-
80
-
81
-
82
-
83
-
84
-
85
-
 86
86 -
 87
87 -
 88
88 -
 89
89 -
 90
90 -
 91
91 -
 92
92 -
 93
93 -
 94
94 -
 95
95 -
 96
96 -
 97
97 -
 98
98 -
 99
99 -
 100
100 -
 101
101 -
 102
102 -
 103
103 -
 104
104 -
 105
105 -
 106
106 -
107
-
108
-
109
-
110
-
111
-
112
-
113
-
114
-
115
-
116
-
117
-
118
-
119
-
120
-
121
-
122
-
123
-
124
-
125
-
126
-
127
-
128
-
129
-
130
-
131
-
132
-
133
-
134
-
135
-
136
-
137
-
138
-
139
-
140
-
141
-
142
-
143
-
144
-
145
-
146
-
147
-
148
-
149
-
150
-
151
-
152
-
153
-
154
-
155
-
156
-
157
-
158
-
159
-
160
-
161
-
162
-
163
-
164
-
165
-
166
-
167
-
168
-
169
-
170
-
171
-
172
-
173
-
174
-
175
-
176
-
177
-
178
-
179
-
180
-
181
-
182
-
183
-
184
-
185
-
186
-
187
-
188
-
189
-
190
-
191
-
192
-
193
-
194
-
195
-
196
-
197
-
198
-
199
-
200
-
201
-
202
-
203
-
204
-
205
-
206
-
207
-
208
-
209
-
210
-
211
-
212
-
213
-
214
-
215
-
216
-
217
-
218
-
219
-
220
 |
 |

(90)
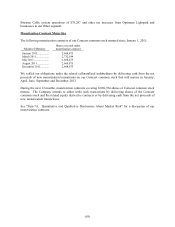
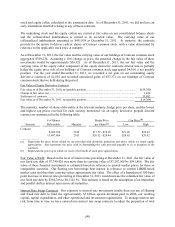
stock and equity collar, calculated at the termination date. As of December 31, 2011, we did not have an
early termination shortfall relating to any of these contracts.
The underlying stock and the equity collars are carried at fair value on our consolidated balance sheets
and the collateralized indebtedness is carried at its accreted value. The carrying value of our
collateralized indebtedness amounted to $455,938 at December 31, 2011. At maturity, the contracts
provide for the option to deliver cash or shares of Comcast common stock, with a value determined by
reference to the applicable stock price at maturity.
As of December 31, 2011, the fair value and the carrying value of our holdings of Comcast common stock
aggregated $509,234. Assuming a 10% change in price, the potential change in the fair value of these
investments would be approximately $50,923. As of December 31, 2011, the net fair value and the
carrying value of the equity collar component of the equity derivative contracts entered into to partially
hedge the equity price risk of our holdings of Comcast common stock aggregated $4,364, a net payable
position. For the year ended December 31, 2011, we recorded a net gain on our outstanding equity
derivative contracts of $1,454 and recorded unrealized gains of $37,371 on our holdings of Comcast
common stock that we held during the period.
Fair Value of Equity Derivative Contracts
Fair value as of December 31, 2010, net payable position .................................................................... $(59,300)
Change in fair value, net ........................................................................................................................ 1,454
Settlement of contracts .......................................................................................................................... 53,482
Fair value as of December 31, 2011, net payable position .................................................................... $ (4,364)
The maturity, number of shares deliverable at the relevant maturity, hedge price per share, and the lowest
and highest cap prices received for each security monetized via an equity derivative prepaid forward
contract are summarized in the following table:
# of Shares Hedge Price Cap Price(b)
Security Deliverable Maturity per Share(a) Low High
Comcast
8,069,934 2012 $17.57 - $18.85 $21.09 $22.62
13,407,684 2013 $20.52 - $24.94 $24.63 $29.92
______________
(a) Represents the price below which we are provided with downside protection and above which we retain upside
appreciation. Also represents the price used in determining the cash proceeds payable to us at inception of the
contracts.
(b) Represents the price up to which we receive the benefit of stock price appreciation.
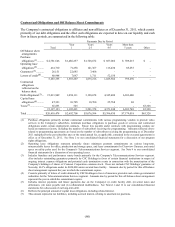
Fair Value of Debt: Based on the level of interest rates prevailing at December 31, 2011, the fair value of
our fixed rate debt of $7,749,426 was more than its carrying value of $7,207,560 by $541,866. The fair
value of these financial instruments is estimated based on reference to quoted market prices for these or
comparable securities. Our floating rate borrowings bear interest in reference to current LIBOR-based
market rates and thus their carrying values approximate fair value. The effect of a hypothetical 100 basis
point decrease in interest rates prevailing at December 31, 2011 would increase the estimated fair value of
our fixed rate debt by $364,768 to $8,114,194. This estimate is based on the assumption of an immediate
and parallel shift in interest rates across all maturities.
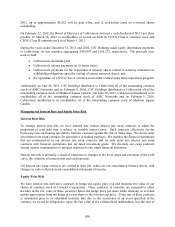
Interest Rate Swap Contracts: Our exposure to interest rate movements results from our use of floating
and fixed rate debt to fund the approximately $3 billion special dividend paid in 2006, our working
capital, capital expenditures, and other operational and investment requirements. To manage interest rate
risk, from time to time we have entered into interest rate swap contracts to adjust the proportion of total