Cablevision 2011 Annual Report Download - page 76
Download and view the complete annual report
Please find page 76 of the 2011 Cablevision annual report below. You can navigate through the pages in the report by either clicking on the pages listed below, or by using the keyword search tool below to find specific information within the annual report.-
 1
1 -
2
-
3
-
4
-
5
-
6
-
7
-
8
-
9
-
10
-
11
-
12
-
13
-
14
-
15
-
16
-
17
-
18
-
19
-
20
-
21
-
22
-
23
-
24
-
25
-
26
-
27
-
28
-
29
-
30
-
31
-
32
-
33
-
34
-
35
-
36
-
37
-
38
-
39
-
40
-
41
-
42
-
43
-
44
-
45
-
46
-
47
-
48
-
49
-
50
-
51
-
52
-
53
-
54
-
55
-
56
-
57
-
58
-
59
-
60
-
61
-
62
-
63
-
64
-
65
-
 66
66 -
 67
67 -
 68
68 -
 69
69 -
 70
70 -
 71
71 -
 72
72 -
 73
73 -
 74
74 -
 75
75 -
 76
76 -
 77
77 -
 78
78 -
 79
79 -
 80
80 -
 81
81 -
 82
82 -
 83
83 -
 84
84 -
 85
85 -
 86
86 -
87
-
88
-
89
-
90
-
91
-
92
-
93
-
94
-
95
-
96
-
97
-
98
-
99
-
100
-
101
-
102
-
103
-
104
-
105
-
106
-
107
-
108
-
109
-
110
-
111
-
112
-
113
-
114
-
115
-
116
-
117
-
118
-
119
-
120
-
121
-
122
-
123
-
124
-
125
-
126
-
127
-
128
-
129
-
130
-
131
-
132
-
133
-
134
-
135
-
136
-
137
-
138
-
139
-
140
-
141
-
142
-
143
-
144
-
145
-
146
-
147
-
148
-
149
-
150
-
151
-
152
-
153
-
154
-
155
-
156
-
157
-
158
-
159
-
160
-
161
-
162
-
163
-
164
-
165
-
166
-
167
-
168
-
169
-
170
-
171
-
172
-
173
-
174
-
175
-
176
-
177
-
178
-
179
-
180
-
181
-
182
-
183
-
184
-
185
-
186
-
187
-
188
-
189
-
190
-
191
-
192
-
193
-
194
-
195
-
196
-
197
-
198
-
199
-
200
-
201
-
202
-
203
-
204
-
205
-
206
-
207
-
208
-
209
-
210
-
211
-
212
-
213
-
214
-
215
-
216
-
217
-
218
-
219
-
220
 |
 |

(70)
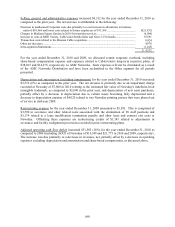
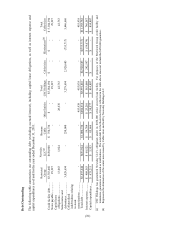
CSC HOLDINGS, LLC
The consolidated statements of income of CSC Holdings are essentially identical to the consolidated
statements of income of Cablevision, except for the following:
Years Ended December 31,
2011 2010 2009
Net income attributable to Cablevision Systems Corporation
stockholders ..........................................................................
.
$ 291,857 $ 360,948 $285,572
Interest expense relating to Cablevision senior notes issued
in April 2004, September 2009 and April 2010 included in
Cablevision's consolidated statements of income .................
.
183,518 180,083 114,120
Interest income related to cash held at Cablevision .................
.
(15) (176) (383)
Interest income included in CSC Holdings' consolidated
statements of income related to interest on Cablevision's
senior notes held by Newsday Holdings LLC (this interest
income is eliminated in the consolidated statements of
income of Cablevision) .........................................................
.
59,079 60,506 62,405
Loss on extinguishment of debt and write-off of deferred
financing costs related to the repurchase of a portion of
Cablevision's senior notes due April 2012 pursuant to a
tender offer ............................................................................
.
- 110,049 587
Miscellaneous income ..............................................................
.
- (14) -
Income tax benefit included in Cablevision's consolidated
statements of income related to the items listed above .........
.
(108,162) (137,119) (71,078)
Net income attributable to CSC Holdings, LLC's sole
member .................................................................................
.
$ 426,277 $ 574,277 $391,223
Refer to Cablevision's Management's Discussion and Analysis of Financial Condition and Results of
Operations herein.
CASH FLOW DISCUSSION
Continuing Operations – Cablevision Systems Corporation
Net Cash Provided by Operating Activities
Net cash provided by operating activities amounted to $1,397,729 for the year ended December 31, 2011
compared to $1,359,618 for the year ended December 31, 2010. The 2011 cash provided by operating
activities resulted from $1,253,632 of income before depreciation and amortization (including
impairments), $359,382 of non-cash items and a $9,500 increase in deferred revenue. Partially offsetting
these increases were decreases in cash of $111,895 resulting from a decrease in liabilities under derivative
contracts, a $49,036 increase in current and other assets and advances to affiliates and a $63,854 decrease
in accounts payable, other liabilities and amounts due to affiliates. The increase in cash provided by
operating activities of $38,111 in 2011 as compared to 2010 resulted from an increase in income from
continuing operations before depreciation and amortization and other non-cash items of $199,515
partially offset by a decrease of $161,404 resulting from changes in working capital, including the timing
of payments and collections of accounts receivable, among other items.
Net cash provided by operating activities amounted to $1,359,618 for the year ended December 31, 2010
compared to $1,247,139 for the year ended December 31, 2009. The 2010 cash provided by operating
activities resulted from $1,094,841 of income before depreciation and amortization (including
impairments), $318,658 of non-cash items and a $70,156 increase in accounts payable, other liabilities
and amounts due to affiliates. Partially offsetting these increases were decreases in cash of $79,854
resulting from an increase in current and other assets and advances to affiliates and a $44,183 decrease in