Cablevision 2011 Annual Report Download - page 70
Download and view the complete annual report
Please find page 70 of the 2011 Cablevision annual report below. You can navigate through the pages in the report by either clicking on the pages listed below, or by using the keyword search tool below to find specific information within the annual report.-
 1
1 -
2
-
3
-
4
-
5
-
6
-
7
-
8
-
9
-
10
-
11
-
12
-
13
-
14
-
15
-
16
-
17
-
18
-
19
-
20
-
21
-
22
-
23
-
24
-
25
-
26
-
27
-
28
-
29
-
30
-
31
-
32
-
33
-
34
-
35
-
36
-
37
-
38
-
39
-
40
-
41
-
42
-
43
-
44
-
45
-
46
-
47
-
48
-
49
-
50
-
51
-
52
-
53
-
54
-
55
-
56
-
57
-
58
-
59
-
 60
60 -
 61
61 -
 62
62 -
 63
63 -
 64
64 -
 65
65 -
 66
66 -
 67
67 -
 68
68 -
 69
69 -
 70
70 -
 71
71 -
 72
72 -
 73
73 -
 74
74 -
 75
75 -
 76
76 -
 77
77 -
 78
78 -
 79
79 -
 80
80 -
81
-
82
-
83
-
84
-
85
-
86
-
87
-
88
-
89
-
90
-
91
-
92
-
93
-
94
-
95
-
96
-
97
-
98
-
99
-
100
-
101
-
102
-
103
-
104
-
105
-
106
-
107
-
108
-
109
-
110
-
111
-
112
-
113
-
114
-
115
-
116
-
117
-
118
-
119
-
120
-
121
-
122
-
123
-
124
-
125
-
126
-
127
-
128
-
129
-
130
-
131
-
132
-
133
-
134
-
135
-
136
-
137
-
138
-
139
-
140
-
141
-
142
-
143
-
144
-
145
-
146
-
147
-
148
-
149
-
150
-
151
-
152
-
153
-
154
-
155
-
156
-
157
-
158
-
159
-
160
-
161
-
162
-
163
-
164
-
165
-
166
-
167
-
168
-
169
-
170
-
171
-
172
-
173
-
174
-
175
-
176
-
177
-
178
-
179
-
180
-
181
-
182
-
183
-
184
-
185
-
186
-
187
-
188
-
189
-
190
-
191
-
192
-
193
-
194
-
195
-
196
-
197
-
198
-
199
-
200
-
201
-
202
-
203
-
204
-
205
-
206
-
207
-
208
-
209
-
210
-
211
-
212
-
213
-
214
-
215
-
216
-
217
-
218
-
219
-
220
 |
 |

(64)
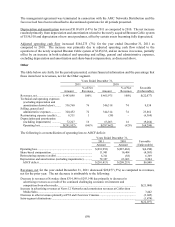
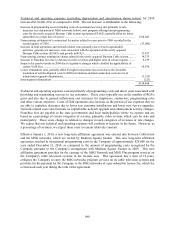
Business Segments Results
Telecommunications Services
The table below sets forth, for the periods presented, certain historical financial information and the
percentage that those items bear to revenues, net for our Telecommunications Services segment:
Years Ended December 31,
2010 2009
Amount
% of Net
Revenues
Amount
% of Net
Revenues
Favorable
(Unfavorable)
Revenues, net ..................
.
$5,735,522 100% $5,431,500 100% $ 304,022
Technical and operating
expenses (excluding
depreciation and
amortization shown
below) .........................
.
2,334,456 41 2,199,996 41 (134,460)
Selling, general and
administrative
expenses ......................
.
1,103,313 19 1,058,057 19 (45,256)
Depreciation and
amortization ................
.
824,029 14 856,919 16 32,890
Operating income ........
.
$1,473,724 26% $1,316,528 24% $ 157,196
The following is a reconciliation of operating income to AOCF:
Years Ended December 31,
2010 2009 Favorable
Amount Amount (Unfavorable)
Operating income ......................................................................
.
$1,473,724 $1,316,528 $157,196
Share-based compensation .........................................................
.
33,885 30,748 3,137
Depreciation and amortization ...................................................
.
824,029 856,919 (32,890)
AOCF .................................................................................
.
$2,331,638 $2,204,195 $127,443
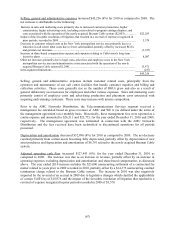
Revenues, net for the year ended December 31, 2010 increased $304,022 (6%) as compared to revenues,
net for the prior year. The net increase is attributable to the following:
Years Ended December 31, Percent
2010 2009 Increase Increase
Video (including analog, digital, pay-per-
view, video-on-demand and digital
video recorder) ........................................
.
$3,237,793 $3,080,078 $157,715 5%
High-speed data ..........................................
.
1,193,624 1,146,789 46,835 4
Voice ..........................................................
.
808,374 771,236 37,138 5
Advertising .................................................
.
135,890 105,633 30,257 29
Other (including installation, home
shopping, advertising sales
commissions, and other products) ...........
.
94,907 94,066 841 1
Total Cable Television ............................
.
5,470,588 5,197,802 272,786 5
Optimum Lightpath ....................................
.
284,034 255,549 28,485 11
Intra-segment eliminations .........................
.
(19,100) (21,851) 2,751 13
Total Telecommunications Services ....
.
$5,735,522 $5,431,500 $304,022 6%
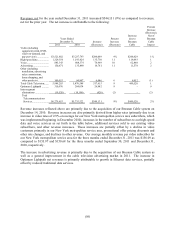
Revenue increases reflected above are primarily derived from higher rates (primarily due to an increase in
video rates of 3.7% on average, which was implemented beginning in December 2009), increases in the
number of subscribers to our high-speed data and voice services as set forth in the table below, including
additional services sold to our existing video subscribers, upgrades by video customers from the level of