Cablevision 2011 Annual Report Download - page 187
Download and view the complete annual report
Please find page 187 of the 2011 Cablevision annual report below. You can navigate through the pages in the report by either clicking on the pages listed below, or by using the keyword search tool below to find specific information within the annual report.-
 1
1 -
2
-
3
-
4
-
5
-
6
-
7
-
8
-
9
-
10
-
11
-
12
-
13
-
14
-
15
-
16
-
17
-
18
-
19
-
20
-
21
-
22
-
23
-
24
-
25
-
26
-
27
-
28
-
29
-
30
-
31
-
32
-
33
-
34
-
35
-
36
-
37
-
38
-
39
-
40
-
41
-
42
-
43
-
44
-
45
-
46
-
47
-
48
-
49
-
50
-
51
-
52
-
53
-
54
-
55
-
56
-
57
-
58
-
59
-
60
-
61
-
62
-
63
-
64
-
65
-
66
-
67
-
68
-
69
-
70
-
71
-
72
-
73
-
74
-
75
-
76
-
77
-
78
-
79
-
80
-
81
-
82
-
83
-
84
-
85
-
86
-
87
-
88
-
89
-
90
-
91
-
92
-
93
-
94
-
95
-
96
-
97
-
98
-
99
-
100
-
101
-
102
-
103
-
104
-
105
-
106
-
107
-
108
-
109
-
110
-
111
-
112
-
113
-
114
-
115
-
116
-
117
-
118
-
119
-
120
-
121
-
122
-
123
-
124
-
125
-
126
-
127
-
128
-
129
-
130
-
131
-
132
-
133
-
134
-
135
-
136
-
137
-
138
-
139
-
140
-
141
-
142
-
143
-
144
-
145
-
146
-
147
-
148
-
149
-
150
-
151
-
152
-
153
-
154
-
155
-
156
-
157
-
158
-
159
-
160
-
161
-
162
-
163
-
164
-
165
-
166
-
167
-
168
-
169
-
170
-
171
-
172
-
173
-
174
-
175
-
176
-
 177
177 -
 178
178 -
 179
179 -
 180
180 -
 181
181 -
 182
182 -
 183
183 -
 184
184 -
 185
185 -
 186
186 -
 187
187 -
 188
188 -
 189
189 -
 190
190 -
 191
191 -
 192
192 -
 193
193 -
 194
194 -
 195
195 -
 196
196 -
 197
197 -
198
-
199
-
200
-
201
-
202
-
203
-
204
-
205
-
206
-
207
-
208
-
209
-
210
-
211
-
212
-
213
-
214
-
215
-
216
-
217
-
218
-
219
-
220
 |
 |

COMBINED NOTES TO CONSOLIDATED FINANCIAL STATEMENTS (continued)
(Dollars in thousands, except per share amounts)
I-63
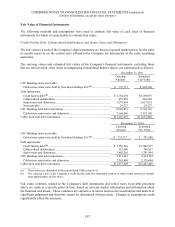
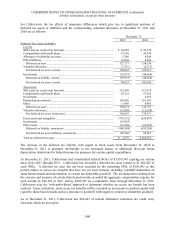
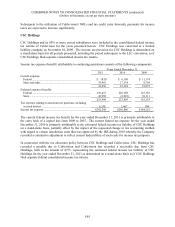
For CSC Holdings, the tax effects of temporary differences which give rise to significant portions of
deferred tax assets or liabilities and the corresponding valuation allowance at December 31, 2011 and
2010 are as follows:
December 31,
2011 2010
Deferred Tax Asset (Liability)
Current
NOLs and tax credit carry forwards .................................................................... $ 79,318 $ 152,163
Compensation and benefit plans ......................................................................... 41,330 43,074
Allowance for doubtful accounts ........................................................................ 5,286 6,260
Other liabilities .................................................................................................... 10,868 8,626
Deferred tax asset ............................................................................................ 136,802 210,123
Valuation allowance ............................................................................................ (5,493 ) (5,968)
Net deferred tax asset, current ......................................................................... 131,309 204,155
Investments ......................................................................................................... (39,937) (48,668)
Deferred tax liability, current .......................................................................... (39,937) (48,668)
Net deferred tax asset, current ......................................................................... 91,372 $155,487
Noncurrent
Tax credit carry forwards .................................................................................... 492 41,634
Compensation and benefit plans ......................................................................... 85,122 57,929
Investments ......................................................................................................... - 4,565
Partnership investments ...................................................................................... 159,456 161,501
Other ................................................................................................................... 11,948 8,483
Deferred tax asset ............................................................................................ 257,018 274,112
Valuation allowance ............................................................................................ (8,854 ) (7,473)
Net deferred tax asset, noncurrent ................................................................... 248,164 266,639
Fixed assets and intangibles ................................................................................ (793,332) (620,987)
Investments ......................................................................................................... (35,943) -
Other assets ......................................................................................................... (19,309) (14,299)
Deferred tax liability, noncurrent .................................................................... (848,584) (635,286)
Net deferred tax liability, noncurrent............................................................... (600,420) (368,647)
Total net deferred tax liability ............................................................................. $(509,048) $(213,160)
The increase in the deferred tax liability with regard to fixed assets from December 31, 2010 to December
31, 2011 is primarily attributable to the estimated impact of additional first-year bonus depreciation
deductions for federal income tax purposes with regard to certain capital expenditures.
At December 31, 2011, on a stand-alone basis CSC Holdings had consolidated federal NOLs of $253,868,
expiring in 2024. CSC Holdings has recorded a deferred tax asset related to $84,816 of such NOLs. A
deferred tax asset has not been recorded for the remaining NOL of $169,052 as this portion relates to
excess tax benefits that have not yet been realized, including 'windfall' deductions on share-based awards
and amortization of certain tax deductible goodwill. The tax deduction resulting from the exercise and
issuance of certain share-based awards exceeded the aggregate compensation expense for such awards by
$46,362 in 2011 and by $154,675 on a cumulative basis through December 31, 2011. Cablevision uses
the 'with-and-without' approach to determine whether an excess tax benefit has been realized. Upon
realization, such excess tax benefits will be recorded as an increase to paid-in capital with regard to share-
based awards and as a decrease in goodwill with regard to certain tax deductible goodwill. However, on a
stand-alone basis CSC Holdings realized excess state tax benefit of $11,196 during the year ended
December 31, 2011. Such excess tax benefit resulted in an increase to additional paid-in capital.
Subsequent to the utilization of CSC Holdings' net operating loss and tax credit carry forwards, including