Cablevision 2011 Annual Report Download - page 103
Download and view the complete annual report
Please find page 103 of the 2011 Cablevision annual report below. You can navigate through the pages in the report by either clicking on the pages listed below, or by using the keyword search tool below to find specific information within the annual report.-
 1
1 -
2
-
3
-
4
-
5
-
6
-
7
-
8
-
9
-
10
-
11
-
12
-
13
-
14
-
15
-
16
-
17
-
18
-
19
-
20
-
21
-
22
-
23
-
24
-
25
-
26
-
27
-
28
-
29
-
30
-
31
-
32
-
33
-
34
-
35
-
36
-
37
-
38
-
39
-
40
-
41
-
42
-
43
-
44
-
45
-
46
-
47
-
48
-
49
-
50
-
51
-
52
-
53
-
54
-
55
-
56
-
57
-
58
-
59
-
60
-
61
-
62
-
63
-
64
-
65
-
66
-
67
-
68
-
69
-
70
-
71
-
72
-
73
-
74
-
75
-
76
-
77
-
78
-
79
-
80
-
81
-
82
-
83
-
84
-
85
-
86
-
87
-
88
-
89
-
90
-
91
-
92
-
 93
93 -
 94
94 -
 95
95 -
 96
96 -
 97
97 -
 98
98 -
 99
99 -
 100
100 -
 101
101 -
 102
102 -
 103
103 -
 104
104 -
 105
105 -
 106
106 -
 107
107 -
 108
108 -
 109
109 -
 110
110 -
 111
111 -
 112
112 -
 113
113 -
114
-
115
-
116
-
117
-
118
-
119
-
120
-
121
-
122
-
123
-
124
-
125
-
126
-
127
-
128
-
129
-
130
-
131
-
132
-
133
-
134
-
135
-
136
-
137
-
138
-
139
-
140
-
141
-
142
-
143
-
144
-
145
-
146
-
147
-
148
-
149
-
150
-
151
-
152
-
153
-
154
-
155
-
156
-
157
-
158
-
159
-
160
-
161
-
162
-
163
-
164
-
165
-
166
-
167
-
168
-
169
-
170
-
171
-
172
-
173
-
174
-
175
-
176
-
177
-
178
-
179
-
180
-
181
-
182
-
183
-
184
-
185
-
186
-
187
-
188
-
189
-
190
-
191
-
192
-
193
-
194
-
195
-
196
-
197
-
198
-
199
-
200
-
201
-
202
-
203
-
204
-
205
-
206
-
207
-
208
-
209
-
210
-
211
-
212
-
213
-
214
-
215
-
216
-
217
-
218
-
219
-
220
 |
 |

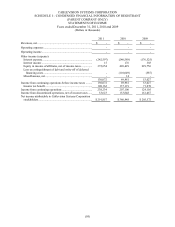
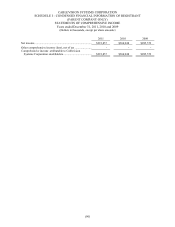
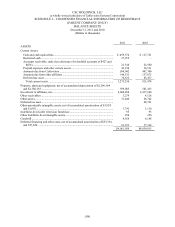
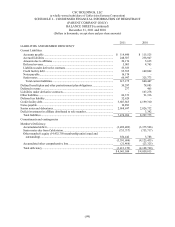
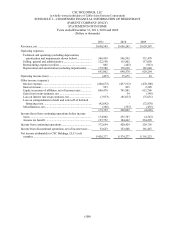
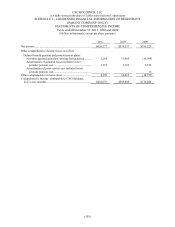
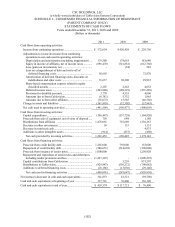
CABLEVISION SYSTEMS CORPORATION
SCHEDULE I – CONDENSED FINANCIAL INFORMATION OF REGISTRANT
(PARENT COMPANY ONLY)
STATEMENTS OF CASH FLOWS
Years ended December 31, 2011, 2010 and 2009
(Dollars in thousands)
(97)
2011 2010 2009
Cash flows from operating activities:
Income from continuing operations ...................................... $ 238,234 $ 207,100 $ 124,105
Adjustments to reconcile income from continuing
operations to net cash used in operating activities:
Equity in income of affiliates, net of income taxes ........ (372,654) (420,429) (229,756)
Loss on extinguishment of debt and write-off of
deferred financing costs .............................................. - 110,049 587
Amortization of deferred financing costs, discounts
on indebtedness and other costs ................................. 5,599 8,546 11,758
Deferred income taxes ................................................... (96,185) (137,119) (71,078)
Amounts due to/from other affiliates ................................. 1,745 (16,935) 5,597
Amounts due to/from CSC Holdings ................................. 6,742 (5,332) (1,865)
Change in assets and liabilities .......................................... (12,665) 5,711 10,716
Net cash used in operating activities ................................. (229,184) (248,409) (149,936)
Cash flows from investing activities:
Distributions from (contributions to) affiliates ..................... 929,947 551,013 (81,515)
Net cash provided by (used in) investing activities ........... 929,947 551,013 (81,515)
Cash flows from financing activities:
Proceeds from issuance of senior notes ................................. - 1,250,000 887,364
Repayment and repurchase of senior notes and
debentures, including tender premiums and fees ............... - (1,078,212) (500,515)
Dividend distributions to common stockholders ................... (162,032) (140,734) (123,499)
Proceeds from stock option exercises and settlements .......... 6,471 21,788 16,355
Deemed repurchases of restricted stock ................................ (35,555) (22,542) (16,175)
Purchase of shares of CNYG Class A common stock,
pursuant to a share repurchase program, held as
treasury shares ................................................................... (555,831) (300,247) -
Additions to deferred financing costs.................................... - (26,572) (19,021)
Net cash provided by (used in) financing activities ........... (746,947) (296,519) 244,509
Net increase (decrease) in cash and cash equivalents ............... (46,184) 6,085 13,058
Cash and cash equivalents at beginning of year ....................... 47,077 40,992 27,934
Cash and cash equivalents at end of year ................................. $ 893 $ 47,077 $ 40,992