Cablevision 2011 Annual Report Download - page 68
Download and view the complete annual report
Please find page 68 of the 2011 Cablevision annual report below. You can navigate through the pages in the report by either clicking on the pages listed below, or by using the keyword search tool below to find specific information within the annual report.-
 1
1 -
2
-
3
-
4
-
5
-
6
-
7
-
8
-
9
-
10
-
11
-
12
-
13
-
14
-
15
-
16
-
17
-
18
-
19
-
20
-
21
-
22
-
23
-
24
-
25
-
26
-
27
-
28
-
29
-
30
-
31
-
32
-
33
-
34
-
35
-
36
-
37
-
38
-
39
-
40
-
41
-
42
-
43
-
44
-
45
-
46
-
47
-
48
-
49
-
50
-
51
-
52
-
53
-
54
-
55
-
56
-
57
-
 58
58 -
 59
59 -
 60
60 -
 61
61 -
 62
62 -
 63
63 -
 64
64 -
 65
65 -
 66
66 -
 67
67 -
 68
68 -
 69
69 -
 70
70 -
 71
71 -
 72
72 -
 73
73 -
 74
74 -
 75
75 -
 76
76 -
 77
77 -
 78
78 -
79
-
80
-
81
-
82
-
83
-
84
-
85
-
86
-
87
-
88
-
89
-
90
-
91
-
92
-
93
-
94
-
95
-
96
-
97
-
98
-
99
-
100
-
101
-
102
-
103
-
104
-
105
-
106
-
107
-
108
-
109
-
110
-
111
-
112
-
113
-
114
-
115
-
116
-
117
-
118
-
119
-
120
-
121
-
122
-
123
-
124
-
125
-
126
-
127
-
128
-
129
-
130
-
131
-
132
-
133
-
134
-
135
-
136
-
137
-
138
-
139
-
140
-
141
-
142
-
143
-
144
-
145
-
146
-
147
-
148
-
149
-
150
-
151
-
152
-
153
-
154
-
155
-
156
-
157
-
158
-
159
-
160
-
161
-
162
-
163
-
164
-
165
-
166
-
167
-
168
-
169
-
170
-
171
-
172
-
173
-
174
-
175
-
176
-
177
-
178
-
179
-
180
-
181
-
182
-
183
-
184
-
185
-
186
-
187
-
188
-
189
-
190
-
191
-
192
-
193
-
194
-
195
-
196
-
197
-
198
-
199
-
200
-
201
-
202
-
203
-
204
-
205
-
206
-
207
-
208
-
209
-
210
-
211
-
212
-
213
-
214
-
215
-
216
-
217
-
218
-
219
-
220
 |
 |

(62)
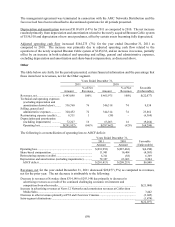
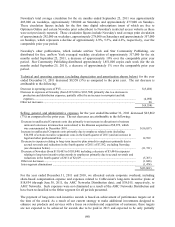
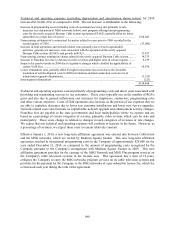
Selling, general and administrative expenses include primarily sales, marketing and advertising expenses,
administrative costs, and costs of customer call centers. Selling, general and administrative expenses
increased $51,206 (4%) for 2010 as compared to 2009. The net increase is attributable to the following:
Increase in expenses of the Telecommunications Services segment .................................................... $45,256
Increase in expenses of the Other segment ........................................................................................... 4,312
Inter-segment eliminations ................................................................................................................... 1,638
$51,206
As a percentage of revenues, selling, general and administrative expenses decreased 1% in 2010
compared to 2009.
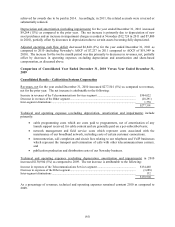
Depreciation and amortization (including impairments) decreased $29,316 (3%) for 2010 as compared to
2009. The net decrease is attributable to the following:
Decrease in expenses of the Telecommunications Services segment ................................................... $(32,890)
Increase in expenses of the Other segment ........................................................................................... 3,574
$(29,316)
Adjusted operating cash flow increased $95,860 (5%) for the year ended December 31, 2010 as compared
to the same period in 2009. The net increase is attributable to the following:
Increase in AOCF of the Telecommunications Services segment ......................................................... $127,443
Decrease in AOCF of the Other segment .............................................................................................. (31,583)
$ 95,860
Interest expense, net increased $40,937 (6%) for 2010 as compared to 2009. The net increase is
attributable to the following:
Increase due to higher average interest rates on our indebtedness, including extension fees to
lenders ................................................................................................................................................ $36,639
Net decrease due to change in average debt balances ........................................................................... (6,693)
Lower interest income .......................................................................................................................... 2,836
Other net increases (including an increase in arrangement fees for term loan extensions) .................. 8,155
$40,937
See "Liquidity and Capital Resources" discussion below for a detail of our various borrower groups.
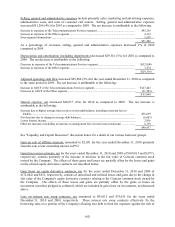
Gain on sale of affiliate interests, amounted to $2,051 for the year ended December 31, 2010 primarily
from the sale of our ownership interest in PVI.
Gain (loss) on investments, net for the years ended December 31, 2010 and 2009 of $109,813 and $(977),
respectively, consists primarily of the increase or decrease in the fair value of Comcast common stock
owned by the Company. The effects of these gains and losses are partially offset by the losses and gains
on the related equity derivative contracts, net described below.
Gain (loss) on equity derivative contracts, net for the years ended December 31, 2010 and 2009 of
$(72,044) and $631, respectively, consists of unrealized and realized losses and gains due to the change in
fair value of the Company's equity derivative contracts relating to the Comcast common stock owned by
the Company. The effects of these losses and gains are partially offset by the gains or losses on
investment securities pledged as collateral, which are included in gain (loss) on investments, net discussed
above.
Loss on interest rate swap contracts, net amounted to $85,013 and $75,631 for the years ended
December 31, 2010 and 2009, respectively. These interest rate swap contracts effectively fix the
borrowing rates on a portion of the Company's floating rate debt to limit the exposure against the risk of