Cablevision 2011 Annual Report Download - page 71
Download and view the complete annual report
Please find page 71 of the 2011 Cablevision annual report below. You can navigate through the pages in the report by either clicking on the pages listed below, or by using the keyword search tool below to find specific information within the annual report.-
 1
1 -
2
-
3
-
4
-
5
-
6
-
7
-
8
-
9
-
10
-
11
-
12
-
13
-
14
-
15
-
16
-
17
-
18
-
19
-
20
-
21
-
22
-
23
-
24
-
25
-
26
-
27
-
28
-
29
-
30
-
31
-
32
-
33
-
34
-
35
-
36
-
37
-
38
-
39
-
40
-
41
-
42
-
43
-
44
-
45
-
46
-
47
-
48
-
49
-
50
-
51
-
52
-
53
-
54
-
55
-
56
-
57
-
58
-
59
-
60
-
 61
61 -
 62
62 -
 63
63 -
 64
64 -
 65
65 -
 66
66 -
 67
67 -
 68
68 -
 69
69 -
 70
70 -
 71
71 -
 72
72 -
 73
73 -
 74
74 -
 75
75 -
 76
76 -
 77
77 -
 78
78 -
 79
79 -
 80
80 -
 81
81 -
82
-
83
-
84
-
85
-
86
-
87
-
88
-
89
-
90
-
91
-
92
-
93
-
94
-
95
-
96
-
97
-
98
-
99
-
100
-
101
-
102
-
103
-
104
-
105
-
106
-
107
-
108
-
109
-
110
-
111
-
112
-
113
-
114
-
115
-
116
-
117
-
118
-
119
-
120
-
121
-
122
-
123
-
124
-
125
-
126
-
127
-
128
-
129
-
130
-
131
-
132
-
133
-
134
-
135
-
136
-
137
-
138
-
139
-
140
-
141
-
142
-
143
-
144
-
145
-
146
-
147
-
148
-
149
-
150
-
151
-
152
-
153
-
154
-
155
-
156
-
157
-
158
-
159
-
160
-
161
-
162
-
163
-
164
-
165
-
166
-
167
-
168
-
169
-
170
-
171
-
172
-
173
-
174
-
175
-
176
-
177
-
178
-
179
-
180
-
181
-
182
-
183
-
184
-
185
-
186
-
187
-
188
-
189
-
190
-
191
-
192
-
193
-
194
-
195
-
196
-
197
-
198
-
199
-
200
-
201
-
202
-
203
-
204
-
205
-
206
-
207
-
208
-
209
-
210
-
211
-
212
-
213
-
214
-
215
-
216
-
217
-
218
-
219
-
220
 |
 |

(65)
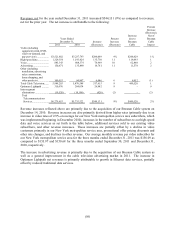
the programming package to which they subscribe, and acquisition transactions that result in the addition
of new subscribers. The acquisition of our Bresnan Cable system on December 14, 2010, resulted in an
approximate $22,100 increase in revenues, net. These increases are partially offset by promotional offer
pricing discounts and a decline in video customers in our New York metropolitan service area and other
rate changes. Our average monthly revenue per video subscriber for the three months ended
December 31, 2010 was $150.68 (for our New York metropolitan service area only) as compared to
$149.04 and $144.03 for the three months ended September 30, 2010 and December 31, 2009,
respectively.
We believe the increase in advertising revenue is primarily due to a general improvement in the cable
television advertising market and political advertising in 2010. The increase in Optimum Lightpath net
revenues is primarily attributable to growth in Ethernet data services, partially offset by reduced
traditional data services and lower intra-segment revenue.
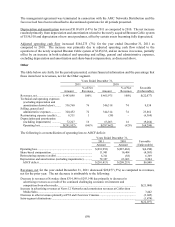
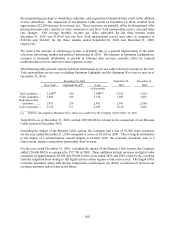
The following table presents certain statistical information as for our cable television systems in the New
York metropolitan service area (excluding Optimum Lightpath) and the Optimum West service area as of
December 31, 2010:
December 31, 2010 September 30, December 31,
New York Optimum West(a) Total 2010 2009
(in thousands)
Total customers .... 3,298(a) 350 3,648(a) 3,321 3,314
Video customers ... 3,008 306 3,314 3,043 3,063
High-speed data
customers .......... 2,653 239 2,892 2,647 2,568
Voice customers ... 2,138 131 2,269 2,129 2,052
______________
(a) Reflects data related to Bresnan Cable, which was acquired by the Company on December 14, 2010.
Total RGUs as of December 31, 2010, include 880,900 RGUs related to the acquisition of our Bresnan
Cable system in December 2010.
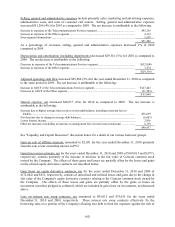
Excluding the impact of the Bresnan Cable system, the Company had a loss of 55,500 video customers
for the year ended December 31, 2010 compared to a loss of 45,100 in 2009. This is largely attributable
to the impact of a retransmission consent dispute in October 2010, the economic downturn, and, to a
lesser extent, intense competition, particularly from Verizon.
For the year ended December 31, 2010, excluding the impact of the Bresnan Cable system, the Company
added 128,600 RGUs as compared to 297,700 in 2009. These additions include increases in digital video
customers of approximately 40,500 and 50,600 for the years ended 2010 and 2009, respectively, resulting
from the migration from analog to full digital across certain regions of our service area. The length of the
economic downturn, along with intense competition, could impact our ability to maintain or increase our
existing customers and revenue in the future.