Cablevision 2011 Annual Report Download - page 129
Download and view the complete annual report
Please find page 129 of the 2011 Cablevision annual report below. You can navigate through the pages in the report by either clicking on the pages listed below, or by using the keyword search tool below to find specific information within the annual report.-
 1
1 -
2
-
3
-
4
-
5
-
6
-
7
-
8
-
9
-
10
-
11
-
12
-
13
-
14
-
15
-
16
-
17
-
18
-
19
-
20
-
21
-
22
-
23
-
24
-
25
-
26
-
27
-
28
-
29
-
30
-
31
-
32
-
33
-
34
-
35
-
36
-
37
-
38
-
39
-
40
-
41
-
42
-
43
-
44
-
45
-
46
-
47
-
48
-
49
-
50
-
51
-
52
-
53
-
54
-
55
-
56
-
57
-
58
-
59
-
60
-
61
-
62
-
63
-
64
-
65
-
66
-
67
-
68
-
69
-
70
-
71
-
72
-
73
-
74
-
75
-
76
-
77
-
78
-
79
-
80
-
81
-
82
-
83
-
84
-
85
-
86
-
87
-
88
-
89
-
90
-
91
-
92
-
93
-
94
-
95
-
96
-
97
-
98
-
99
-
100
-
101
-
102
-
103
-
104
-
105
-
106
-
107
-
108
-
109
-
110
-
111
-
112
-
113
-
114
-
115
-
116
-
117
-
118
-
 119
119 -
 120
120 -
 121
121 -
 122
122 -
 123
123 -
 124
124 -
 125
125 -
 126
126 -
 127
127 -
 128
128 -
 129
129 -
 130
130 -
 131
131 -
 132
132 -
 133
133 -
 134
134 -
 135
135 -
 136
136 -
 137
137 -
 138
138 -
 139
139 -
140
-
141
-
142
-
143
-
144
-
145
-
146
-
147
-
148
-
149
-
150
-
151
-
152
-
153
-
154
-
155
-
156
-
157
-
158
-
159
-
160
-
161
-
162
-
163
-
164
-
165
-
166
-
167
-
168
-
169
-
170
-
171
-
172
-
173
-
174
-
175
-
176
-
177
-
178
-
179
-
180
-
181
-
182
-
183
-
184
-
185
-
186
-
187
-
188
-
189
-
190
-
191
-
192
-
193
-
194
-
195
-
196
-
197
-
198
-
199
-
200
-
201
-
202
-
203
-
204
-
205
-
206
-
207
-
208
-
209
-
210
-
211
-
212
-
213
-
214
-
215
-
216
-
217
-
218
-
219
-
220
 |
 |

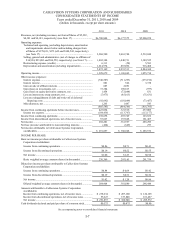
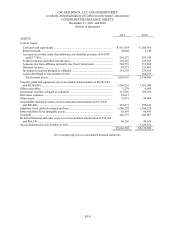
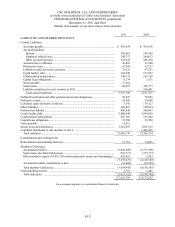
CABLEVISION SYSTEMS CORPORATION AND SUBSIDIARIES
CONSOLIDATED BALANCE SHEETS
December 31, 2011 and 2010
(Dollars in thousands)
I-5
2011 2010
ASSETS
Current Assets:
Cash and cash equivalents ................................................................................... $ 611,947 $ 313,991
Restricted cash .................................................................................................... 29,068 1,149
Accounts receivable, trade (less allowance for doubtful accounts of $14,907
and $17,786) .................................................................................................... 295,277 295,149
Prepaid expenses and other current assets ........................................................... 135,579 127,058
Amounts due from affiliates................................................................................ 6,818 25,127
Deferred tax asset ................................................................................................ 84,925 103,645
Investment securities pledged as collateral ......................................................... 191,338 235,932
Assets distributed to stockholders in 2011 .......................................................... - 564,231
Total current assets .......................................................................................... 1,354,952 1,666,282
Property, plant and equipment, net of accumulated depreciation of $9,221,694
and $8,564,884 .................................................................................................... 3,269,232 3,361,590
Other receivables .................................................................................................... 3,279 4,843
Investment securities pledged as collateral ............................................................. 317,896 235,932
Derivative contracts ................................................................................................ 18,617 -
Other assets ............................................................................................................. 53,871 44,086
Deferred tax asset ................................................................................................... - 99,287
Amortizable intangible assets, net of accumulated amortization of $115,043
and $60,028 ......................................................................................................... 252,871 292,144
Indefinite-lived cable television franchises ............................................................ 1,240,228 1,240,228
Other indefinite-lived intangible assets .................................................................. 55,895 66,895
Goodwill ................................................................................................................. 442,773 442,067
Deferred financing and other costs, net of accumulated amortization of $81,269
and $72,642 ......................................................................................................... 133,711 140,064
Assets distributed to stockholders in 2011 ............................................................. - 1,273,674
$7,143,325 $8,867,092
See accompanying notes to consolidated financial statements.