Cablevision 2011 Annual Report Download - page 210
Download and view the complete annual report
Please find page 210 of the 2011 Cablevision annual report below. You can navigate through the pages in the report by either clicking on the pages listed below, or by using the keyword search tool below to find specific information within the annual report.-
 1
1 -
2
-
3
-
4
-
5
-
6
-
7
-
8
-
9
-
10
-
11
-
12
-
13
-
14
-
15
-
16
-
17
-
18
-
19
-
20
-
21
-
22
-
23
-
24
-
25
-
26
-
27
-
28
-
29
-
30
-
31
-
32
-
33
-
34
-
35
-
36
-
37
-
38
-
39
-
40
-
41
-
42
-
43
-
44
-
45
-
46
-
47
-
48
-
49
-
50
-
51
-
52
-
53
-
54
-
55
-
56
-
57
-
58
-
59
-
60
-
61
-
62
-
63
-
64
-
65
-
66
-
67
-
68
-
69
-
70
-
71
-
72
-
73
-
74
-
75
-
76
-
77
-
78
-
79
-
80
-
81
-
82
-
83
-
84
-
85
-
86
-
87
-
88
-
89
-
90
-
91
-
92
-
93
-
94
-
95
-
96
-
97
-
98
-
99
-
100
-
101
-
102
-
103
-
104
-
105
-
106
-
107
-
108
-
109
-
110
-
111
-
112
-
113
-
114
-
115
-
116
-
117
-
118
-
119
-
120
-
121
-
122
-
123
-
124
-
125
-
126
-
127
-
128
-
129
-
130
-
131
-
132
-
133
-
134
-
135
-
136
-
137
-
138
-
139
-
140
-
141
-
142
-
143
-
144
-
145
-
146
-
147
-
148
-
149
-
150
-
151
-
152
-
153
-
154
-
155
-
156
-
157
-
158
-
159
-
160
-
161
-
162
-
163
-
164
-
165
-
166
-
167
-
168
-
169
-
170
-
171
-
172
-
173
-
174
-
175
-
176
-
177
-
178
-
179
-
180
-
181
-
182
-
183
-
184
-
185
-
186
-
187
-
188
-
189
-
190
-
191
-
192
-
193
-
194
-
195
-
196
-
197
-
198
-
199
-
 200
200 -
 201
201 -
 202
202 -
 203
203 -
 204
204 -
 205
205 -
 206
206 -
 207
207 -
 208
208 -
 209
209 -
 210
210 -
 211
211 -
 212
212 -
 213
213 -
 214
214 -
 215
215 -
 216
216 -
 217
217 -
 218
218 -
 219
219 -
 220
220
 |
 |

COMBINED NOTES TO CONSOLIDATED FINANCIAL STATEMENTS (continued)
(Dollars in thousands, except per share amounts)
I-86
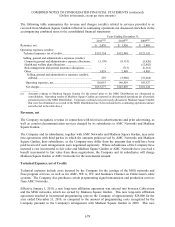
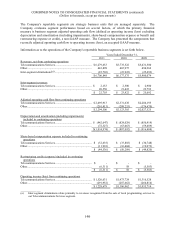
The Company's reportable segments are strategic business units that are managed separately. The
Company evaluates segment performance based on several factors, of which the primary financial
measure is business segment adjusted operating cash flow (defined as operating income (loss) excluding
depreciation and amortization (including impairments), share-based compensation expense or benefit and
restructuring expense or credit), a non-GAAP measure. The Company has presented the components that
reconcile adjusted operating cash flow to operating income (loss), an accepted GAAP measure.
Information as to the operations of the Company's reportable business segments is set forth below.
Years Ended December 31,
2011 2010 2009
Revenues, net from continuing operations
Telecommunications Services .................................................. $ 6,279,653 $5,735,522 $5,431,500
Other ......................................................................................... 443,898 465,975 494,266
Inter-segment eliminations(a) ................................................... (22,703) (23,922) (25,692)
$ 6,700,848 $6,177,575 $5,900,074
Inter-segment revenues
Telecommunications Services .................................................. $ 2,153 $ 2,500 $ 2,900
Other ......................................................................................... 20,550 21,422 22,792
$ 22,703 $ 23,922 $ 25,692
Adjusted operating cash flow from continuing operations
Telecommunications Services .................................................. $ 2,495,913 $2,331,638 $2,204,195
Other ......................................................................................... (201,413) (208,253) (176,670)
$ 2,294,500 $2,123,385 $2,027,525
Depreciation and amortization (including impairments)
included in continuing operations
Telecommunications Services .................................................. $ (942,647) $ (824,029) $ (856,919)
Other ......................................................................................... (72,327) (63,063) (59,489)
$(1,014,974) $ (887,092) $ (916,408)
Share-based compensation expense included in continuing
operations
Telecommunications Services .................................................. $ (32,635) $ (33,885) $ (30,748)
Other ......................................................................................... (11,901) (16,404) (19,072)
$ (44,536) $ (50,289) $ (49,820)
Restructuring credits (expense) included in continuing
operations
Telecommunications Services .................................................. $ - $ - $ -
Other ......................................................................................... (6,311) 58 (5,583)
$ (6,311) $ 58 $ (5,583)
Operating income (loss) from continuing operations
Telecommunications Services .................................................. $ 1,520,631 $1,473,724 $1,316,528
Other ......................................................................................... (291,952) (287,662) (260,814)
$ 1,228,679 $1,186,062 $1,055,714
_______________
(a) Inter-segment eliminations relate primarily to revenues recognized from the sale of local programming services to
our Telecommunications Services segment.