Cablevision 2011 Annual Report Download - page 180
Download and view the complete annual report
Please find page 180 of the 2011 Cablevision annual report below. You can navigate through the pages in the report by either clicking on the pages listed below, or by using the keyword search tool below to find specific information within the annual report.-
 1
1 -
2
-
3
-
4
-
5
-
6
-
7
-
8
-
9
-
10
-
11
-
12
-
13
-
14
-
15
-
16
-
17
-
18
-
19
-
20
-
21
-
22
-
23
-
24
-
25
-
26
-
27
-
28
-
29
-
30
-
31
-
32
-
33
-
34
-
35
-
36
-
37
-
38
-
39
-
40
-
41
-
42
-
43
-
44
-
45
-
46
-
47
-
48
-
49
-
50
-
51
-
52
-
53
-
54
-
55
-
56
-
57
-
58
-
59
-
60
-
61
-
62
-
63
-
64
-
65
-
66
-
67
-
68
-
69
-
70
-
71
-
72
-
73
-
74
-
75
-
76
-
77
-
78
-
79
-
80
-
81
-
82
-
83
-
84
-
85
-
86
-
87
-
88
-
89
-
90
-
91
-
92
-
93
-
94
-
95
-
96
-
97
-
98
-
99
-
100
-
101
-
102
-
103
-
104
-
105
-
106
-
107
-
108
-
109
-
110
-
111
-
112
-
113
-
114
-
115
-
116
-
117
-
118
-
119
-
120
-
121
-
122
-
123
-
124
-
125
-
126
-
127
-
128
-
129
-
130
-
131
-
132
-
133
-
134
-
135
-
136
-
137
-
138
-
139
-
140
-
141
-
142
-
143
-
144
-
145
-
146
-
147
-
148
-
149
-
150
-
151
-
152
-
153
-
154
-
155
-
156
-
157
-
158
-
159
-
160
-
161
-
162
-
163
-
164
-
165
-
166
-
167
-
168
-
169
-
 170
170 -
 171
171 -
 172
172 -
 173
173 -
 174
174 -
 175
175 -
 176
176 -
 177
177 -
 178
178 -
 179
179 -
 180
180 -
 181
181 -
 182
182 -
 183
183 -
 184
184 -
 185
185 -
 186
186 -
 187
187 -
 188
188 -
 189
189 -
 190
190 -
191
-
192
-
193
-
194
-
195
-
196
-
197
-
198
-
199
-
200
-
201
-
202
-
203
-
204
-
205
-
206
-
207
-
208
-
209
-
210
-
211
-
212
-
213
-
214
-
215
-
216
-
217
-
218
-
219
-
220
 |
 |

COMBINED NOTES TO CONSOLIDATED FINANCIAL STATEMENTS (continued)
(Dollars in thousands, except per share amounts)
I-56
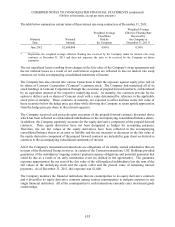
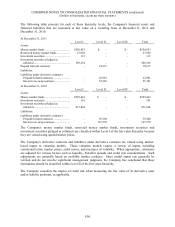
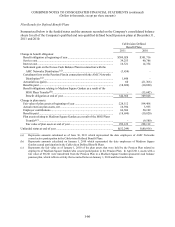
The following table presents for each of these hierarchy levels, the Company's financial assets and
financial liabilities that are measured at fair value on a recurring basis at December 31, 2011 and
December 31, 2010:
At December 31, 2011:
Level I Level II Level III Total
Assets:
Money market funds .................................. $556,853 $ - $ - $556,853
Restricted money market funds .................. 27,920 - - 27,920
Investment securities .................................. 113 - - 113
Investment securities pledged as
collateral .................................................. 509,234 - - 509,234
Prepaid forward contracts - 18,617 - 18,617
Liabilities:
Liabilities under derivative contracts:
Prepaid forward contracts ....................... - 22,981 - 22,981
Interest rate swap contracts ..................... - 55,383 - 55,383
At December 31, 2010:
Level I Level II Level III Total
Assets:
Money market funds .................................. $259,463 $ - $ - $259,463
Investment securities .................................. 101 - - 101
Investment securities pledged as
collateral .................................................. 471,864 - - 471,864
Liabilities:
Liabilities under derivative contracts:
Prepaid forward contracts ....................... - 59,300 - 59,300
Interest rate swap contracts ..................... - 167,278 - 167,278
The Company's money market funds, restricted money market funds, investment securities and
investment securities pledged as collateral are classified within Level I of the fair value hierarchy because
they are valued using quoted market prices.
The Company's derivative contracts and liabilities under derivative contracts are valued using market-
based inputs to valuation models. These valuation models require a variety of inputs, including
contractual terms, market prices, yield curves, and measures of volatility. When appropriate, valuations
are adjusted for various factors such as liquidity, bid/offer spreads and credit risk considerations. Such
adjustments are generally based on available market evidence. Since model inputs can generally be
verified and do not involve significant management judgment, the Company has concluded that these
instruments should be classified within Level II of the fair value hierarchy.
The Company considers the impact of credit risk when measuring the fair value of its derivative asset
and/or liability positions, as applicable.