Cablevision 2011 Annual Report Download - page 62
Download and view the complete annual report
Please find page 62 of the 2011 Cablevision annual report below. You can navigate through the pages in the report by either clicking on the pages listed below, or by using the keyword search tool below to find specific information within the annual report.-
 1
1 -
2
-
3
-
4
-
5
-
6
-
7
-
8
-
9
-
10
-
11
-
12
-
13
-
14
-
15
-
16
-
17
-
18
-
19
-
20
-
21
-
22
-
23
-
24
-
25
-
26
-
27
-
28
-
29
-
30
-
31
-
32
-
33
-
34
-
35
-
36
-
37
-
38
-
39
-
40
-
41
-
42
-
43
-
44
-
45
-
46
-
47
-
48
-
49
-
50
-
51
-
 52
52 -
 53
53 -
 54
54 -
 55
55 -
 56
56 -
 57
57 -
 58
58 -
 59
59 -
 60
60 -
 61
61 -
 62
62 -
 63
63 -
 64
64 -
 65
65 -
 66
66 -
 67
67 -
 68
68 -
 69
69 -
 70
70 -
 71
71 -
 72
72 -
73
-
74
-
75
-
76
-
77
-
78
-
79
-
80
-
81
-
82
-
83
-
84
-
85
-
86
-
87
-
88
-
89
-
90
-
91
-
92
-
93
-
94
-
95
-
96
-
97
-
98
-
99
-
100
-
101
-
102
-
103
-
104
-
105
-
106
-
107
-
108
-
109
-
110
-
111
-
112
-
113
-
114
-
115
-
116
-
117
-
118
-
119
-
120
-
121
-
122
-
123
-
124
-
125
-
126
-
127
-
128
-
129
-
130
-
131
-
132
-
133
-
134
-
135
-
136
-
137
-
138
-
139
-
140
-
141
-
142
-
143
-
144
-
145
-
146
-
147
-
148
-
149
-
150
-
151
-
152
-
153
-
154
-
155
-
156
-
157
-
158
-
159
-
160
-
161
-
162
-
163
-
164
-
165
-
166
-
167
-
168
-
169
-
170
-
171
-
172
-
173
-
174
-
175
-
176
-
177
-
178
-
179
-
180
-
181
-
182
-
183
-
184
-
185
-
186
-
187
-
188
-
189
-
190
-
191
-
192
-
193
-
194
-
195
-
196
-
197
-
198
-
199
-
200
-
201
-
202
-
203
-
204
-
205
-
206
-
207
-
208
-
209
-
210
-
211
-
212
-
213
-
214
-
215
-
216
-
217
-
218
-
219
-
220
 |
 |

(56)
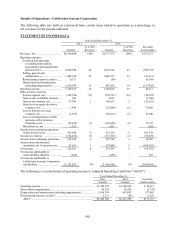
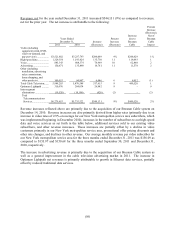
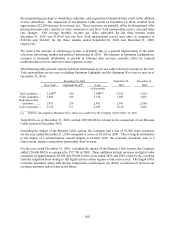
Revenues, net for the year ended December 31, 2011 increased $544,131 (9%) as compared to revenues,
net for the prior year. The net increase is attributable to the following:
Years Ended
December 31, Increase
Percent
Increase
Increase
due to
Bresnan
Percent
Increase
(Decrease),
Net of
Bresnan
Cable
2011 2010 (Decrease) (Decrease) Cable Impact
Video (including
equipment rental, DVR,
video-on-demand, and
pay-per-view) ................... $3,521,882 $3,237,793 $284,089 9% $248,629 1%
High-speed data ................. 1,329,354 1,193,624 135,730 11 119,493 1
Voice.................................. 885,343 808,374 76,969 10 62,868 2
Advertising ........................ 150,671 135,890 14,781 11 11,578 2
Other (including
installation, advertising
sales commissions,
home shopping, and
other products) ................. 100,953 94,907 6,046 6 6,952 (1)
Total Cable Television ....... 5,988,203 5,470,588 517,615 9 449,520 1
Optimum Lightpath ........... 310,976 284,034 26,942 9 - 9
Intra-segment
eliminations ..................... (19,526) (19,100) (426) (2) - (2)
Total
Telecommunications
Services .......................... $6,279,653 $5,735,522 $544,131 9% $449,520 2%
Revenue increases reflected above are primarily due to the acquisition of our Bresnan Cable system on
December 14, 2010. Revenue increases are also primarily derived from higher rates (primarily due to an
increase in video rates of 2.9% on average for our New York metropolitan service area subscribers, which
was implemented beginning in December 2010), increases in the number of subscribers to our high-speed
data and voice services as set forth in the table below, additional services sold to our existing video
subscribers, and other revenue increases. These increases are partially offset by a decline in video
customers primarily in our New York metropolitan service area, promotional offer pricing discounts and
other rate changes, and declines in other revenue. Our average monthly revenue per video subscriber for
our New York metropolitan service area for the three months ended December 31, 2011 was $156.09 as
compared to $153.97 and $150.68 for the three months ended September 30, 2011 and December 31,
2010, respectively.
The increase in advertising revenue is primarily due to the acquisition of our Bresnan Cable system as
well as a general improvement in the cable television advertising market in 2011. The increase in
Optimum Lightpath net revenues is primarily attributable to growth in Ethernet data services, partially
offset by reduced traditional data services.