Cablevision 2011 Annual Report Download - page 58
Download and view the complete annual report
Please find page 58 of the 2011 Cablevision annual report below. You can navigate through the pages in the report by either clicking on the pages listed below, or by using the keyword search tool below to find specific information within the annual report.-
 1
1 -
2
-
3
-
4
-
5
-
6
-
7
-
8
-
9
-
10
-
11
-
12
-
13
-
14
-
15
-
16
-
17
-
18
-
19
-
20
-
21
-
22
-
23
-
24
-
25
-
26
-
27
-
28
-
29
-
30
-
31
-
32
-
33
-
34
-
35
-
36
-
37
-
38
-
39
-
40
-
41
-
42
-
43
-
44
-
45
-
46
-
47
-
 48
48 -
 49
49 -
 50
50 -
 51
51 -
 52
52 -
 53
53 -
 54
54 -
 55
55 -
 56
56 -
 57
57 -
 58
58 -
 59
59 -
 60
60 -
 61
61 -
 62
62 -
 63
63 -
 64
64 -
 65
65 -
 66
66 -
 67
67 -
 68
68 -
69
-
70
-
71
-
72
-
73
-
74
-
75
-
76
-
77
-
78
-
79
-
80
-
81
-
82
-
83
-
84
-
85
-
86
-
87
-
88
-
89
-
90
-
91
-
92
-
93
-
94
-
95
-
96
-
97
-
98
-
99
-
100
-
101
-
102
-
103
-
104
-
105
-
106
-
107
-
108
-
109
-
110
-
111
-
112
-
113
-
114
-
115
-
116
-
117
-
118
-
119
-
120
-
121
-
122
-
123
-
124
-
125
-
126
-
127
-
128
-
129
-
130
-
131
-
132
-
133
-
134
-
135
-
136
-
137
-
138
-
139
-
140
-
141
-
142
-
143
-
144
-
145
-
146
-
147
-
148
-
149
-
150
-
151
-
152
-
153
-
154
-
155
-
156
-
157
-
158
-
159
-
160
-
161
-
162
-
163
-
164
-
165
-
166
-
167
-
168
-
169
-
170
-
171
-
172
-
173
-
174
-
175
-
176
-
177
-
178
-
179
-
180
-
181
-
182
-
183
-
184
-
185
-
186
-
187
-
188
-
189
-
190
-
191
-
192
-
193
-
194
-
195
-
196
-
197
-
198
-
199
-
200
-
201
-
202
-
203
-
204
-
205
-
206
-
207
-
208
-
209
-
210
-
211
-
212
-
213
-
214
-
215
-
216
-
217
-
218
-
219
-
220
 |
 |

(52)
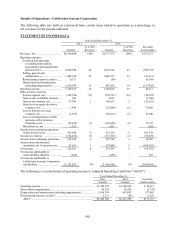
Comparison of Consolidated Year Ended December 31, 2011 Versus Year Ended December 31,
2010
Consolidated Results – Cablevision Systems Corporation
We classify our operations into two reportable segments:
• Telecommunications Services, consisting principally of our video, high-speed data, VoIP
services and the commercial high-speed data and voice services operations of Optimum
Lightpath; and
• Other, consisting principally of (i) Newsday, which includes the Newsday daily newspaper,
amNew York, Star Community Publishing Group, and online websites including newsday.com
and exploreLI.com; (ii) our motion picture theatre business, Clearview Cinemas, (iii) the News
12 Networks, (iv) the MSG Varsity network, (v) Cablevision Media Sales, a cable television
advertising company, and (vi) certain other businesses and unallocated corporate costs.
We allocate certain amounts of our corporate overhead to each segment based upon their proportionate
estimated usage of services, except for Newsday as to which we allocated the incremental costs incurred
in providing these services through September 30, 2009. Subsequent to September 30, 2009, we allocated
certain amounts of our corporate overhead to Newsday based upon its proportionate estimated usage of
such services. Corporate overhead costs previously allocated to AMC Networks and Madison Square
Garden that were not eliminated as a result of the AMC Networks Distribution in June 2011 and the MSG
Distribution in February 2010 have been reclassified to continuing operations. Subsequent to July 1,
2011 and January 1, 2010, amounts allocated to AMC Networks and Madison Square Garden,
respectively, represent charges pursuant to transition services agreements.
The segment financial information set forth below, including the discussion related to individual line
items, does not reflect inter-segment eliminations unless specifically indicated.
See "Business Segments Results" for a discussion relating to the operating results of our segments. In
those sections, we provide detailed analysis of the reasons for increases or decreases in the various line
items at the segment level.
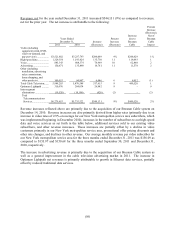
Revenues, net for the year ended December 31, 2011 increased $523,273 (8%) as compared to revenues,
net for the prior year. The net increase is attributable to the following:
Increase in revenues of the Telecommunications Services segment ..................................................... $544,131
Decrease in revenues of the Other segment ........................................................................................... (22,077)
Inter-segment eliminations .................................................................................................................... 1,219
$523,273
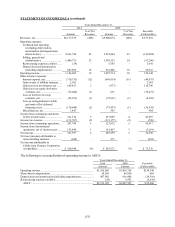
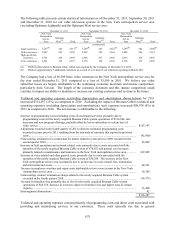
Technical and operating expenses (excluding depreciation, amortization and impairments) include
primarily:
• cable programming costs which are costs paid to programmers, net of amortization of any
launch support received, for cable content and are generally paid on a per-subscriber basis;
• network management and field service costs which represent costs associated with the
maintenance of our broadband network, including costs of certain customer connections;
• interconnection, call completion and circuit fees relating to our telephone and VoIP businesses
which represent the transport and termination of calls with other telecommunications carriers;
and
• publication production and distribution costs of our Newsday business.