Cablevision 2011 Annual Report Download - page 194
Download and view the complete annual report
Please find page 194 of the 2011 Cablevision annual report below. You can navigate through the pages in the report by either clicking on the pages listed below, or by using the keyword search tool below to find specific information within the annual report.-
 1
1 -
2
-
3
-
4
-
5
-
6
-
7
-
8
-
9
-
10
-
11
-
12
-
13
-
14
-
15
-
16
-
17
-
18
-
19
-
20
-
21
-
22
-
23
-
24
-
25
-
26
-
27
-
28
-
29
-
30
-
31
-
32
-
33
-
34
-
35
-
36
-
37
-
38
-
39
-
40
-
41
-
42
-
43
-
44
-
45
-
46
-
47
-
48
-
49
-
50
-
51
-
52
-
53
-
54
-
55
-
56
-
57
-
58
-
59
-
60
-
61
-
62
-
63
-
64
-
65
-
66
-
67
-
68
-
69
-
70
-
71
-
72
-
73
-
74
-
75
-
76
-
77
-
78
-
79
-
80
-
81
-
82
-
83
-
84
-
85
-
86
-
87
-
88
-
89
-
90
-
91
-
92
-
93
-
94
-
95
-
96
-
97
-
98
-
99
-
100
-
101
-
102
-
103
-
104
-
105
-
106
-
107
-
108
-
109
-
110
-
111
-
112
-
113
-
114
-
115
-
116
-
117
-
118
-
119
-
120
-
121
-
122
-
123
-
124
-
125
-
126
-
127
-
128
-
129
-
130
-
131
-
132
-
133
-
134
-
135
-
136
-
137
-
138
-
139
-
140
-
141
-
142
-
143
-
144
-
145
-
146
-
147
-
148
-
149
-
150
-
151
-
152
-
153
-
154
-
155
-
156
-
157
-
158
-
159
-
160
-
161
-
162
-
163
-
164
-
165
-
166
-
167
-
168
-
169
-
170
-
171
-
172
-
173
-
174
-
175
-
176
-
177
-
178
-
179
-
180
-
181
-
182
-
183
-
 184
184 -
 185
185 -
 186
186 -
 187
187 -
 188
188 -
 189
189 -
 190
190 -
 191
191 -
 192
192 -
 193
193 -
 194
194 -
 195
195 -
 196
196 -
 197
197 -
 198
198 -
 199
199 -
 200
200 -
 201
201 -
 202
202 -
 203
203 -
 204
204 -
205
-
206
-
207
-
208
-
209
-
210
-
211
-
212
-
213
-
214
-
215
-
216
-
217
-
218
-
219
-
220
 |
 |

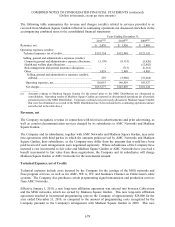
COMBINED NOTES TO CONSOLIDATED FINANCIAL STATEMENTS (continued)
(Dollars in thousands, except per share amounts)
I-70
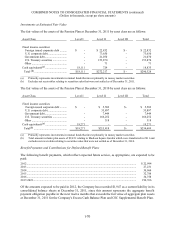
Investments at Estimated Fair Value
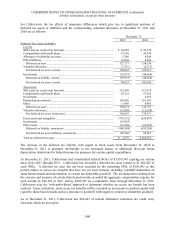
The fair values of the assets of the Pension Plan at December 31, 2011 by asset class are as follows:
______________
(a) Primarily represents investments in mutual funds that invest primarily in money market securities.
(b) Excludes net receivables relating to securities sales that were not settled as of December 31, 2011.
The fair values of the assets of the Pension Plan at December 31, 2010 by asset class are as follows:
______________
(a) Primarily represents investments in mutual funds that invest primarily in money market securities.
(b) Total amount includes plan assets of $9,451 relating to Madison Square Garden which were transferred in 2011 and
excludes net receivables relating to securities sales that were not settled as of December 31, 2010.
Benefit Payments and Contributions for Defined Benefit Plans
The following benefit payments, which reflect expected future service, as appropriate, are expected to be
paid:
2012 ........................................................................................................................................................ $ 22,994
2013 ........................................................................................................................................................ 27,231
2014 ........................................................................................................................................................ 30,964
2015 ........................................................................................................................................................ 32,788
2016 ........................................................................................................................................................ 34,758
2017-2021 ............................................................................................................................................... 199,766
Of the amounts expected to be paid in 2012, the Company has recorded $1,947 as a current liability in its
consolidated balance sheets at December 31, 2011, since this amount represents the aggregate benefit
payment obligation payable in the next twelve months that exceeds the fair value of aggregate plan assets
at December 31, 2011 for the Company's Excess Cash Balance Plan and CSC Supplemental Benefit Plan.
Asset Class Level I Level II Level III Total
Fixed income securities:
Foreign issued corporate debt .........
.
$ - $ 22,832 $ - $ 22,832
U.S. corporate debt ..........................
.
- 73,650 - 73,650
Government debt ..............................
.
- 21,070 - 21,070
U.S. Treasury securities ...................
.
- 153,870 - 153,870
Other ................................................
.
- 71 - 71
Cash equivalents(a) .............................
.
18,111 724 - 18,835
Total (b) ............................................
.
$18,111 $272,217 $ - $290,328
Asset Class Level I Level II Level III Total
Fixed income securities:
Foreign issued corporate debt .........
.
$ - $ 5,502 $- $ 5,502
U.S. corporate debt ..........................
.
35,897 35,897
Government debt ..............................
.
- 7,449 - 7,449
U.S. Treasury securities ...................
.
- 166,252 - 166,252
Other ................................................
.
- 318 - 318
Cash equivalents(a) .............................
.
19,271 - - 19,271
Total(b) .............................................
.
$19,271 $215,418 $- $234,689